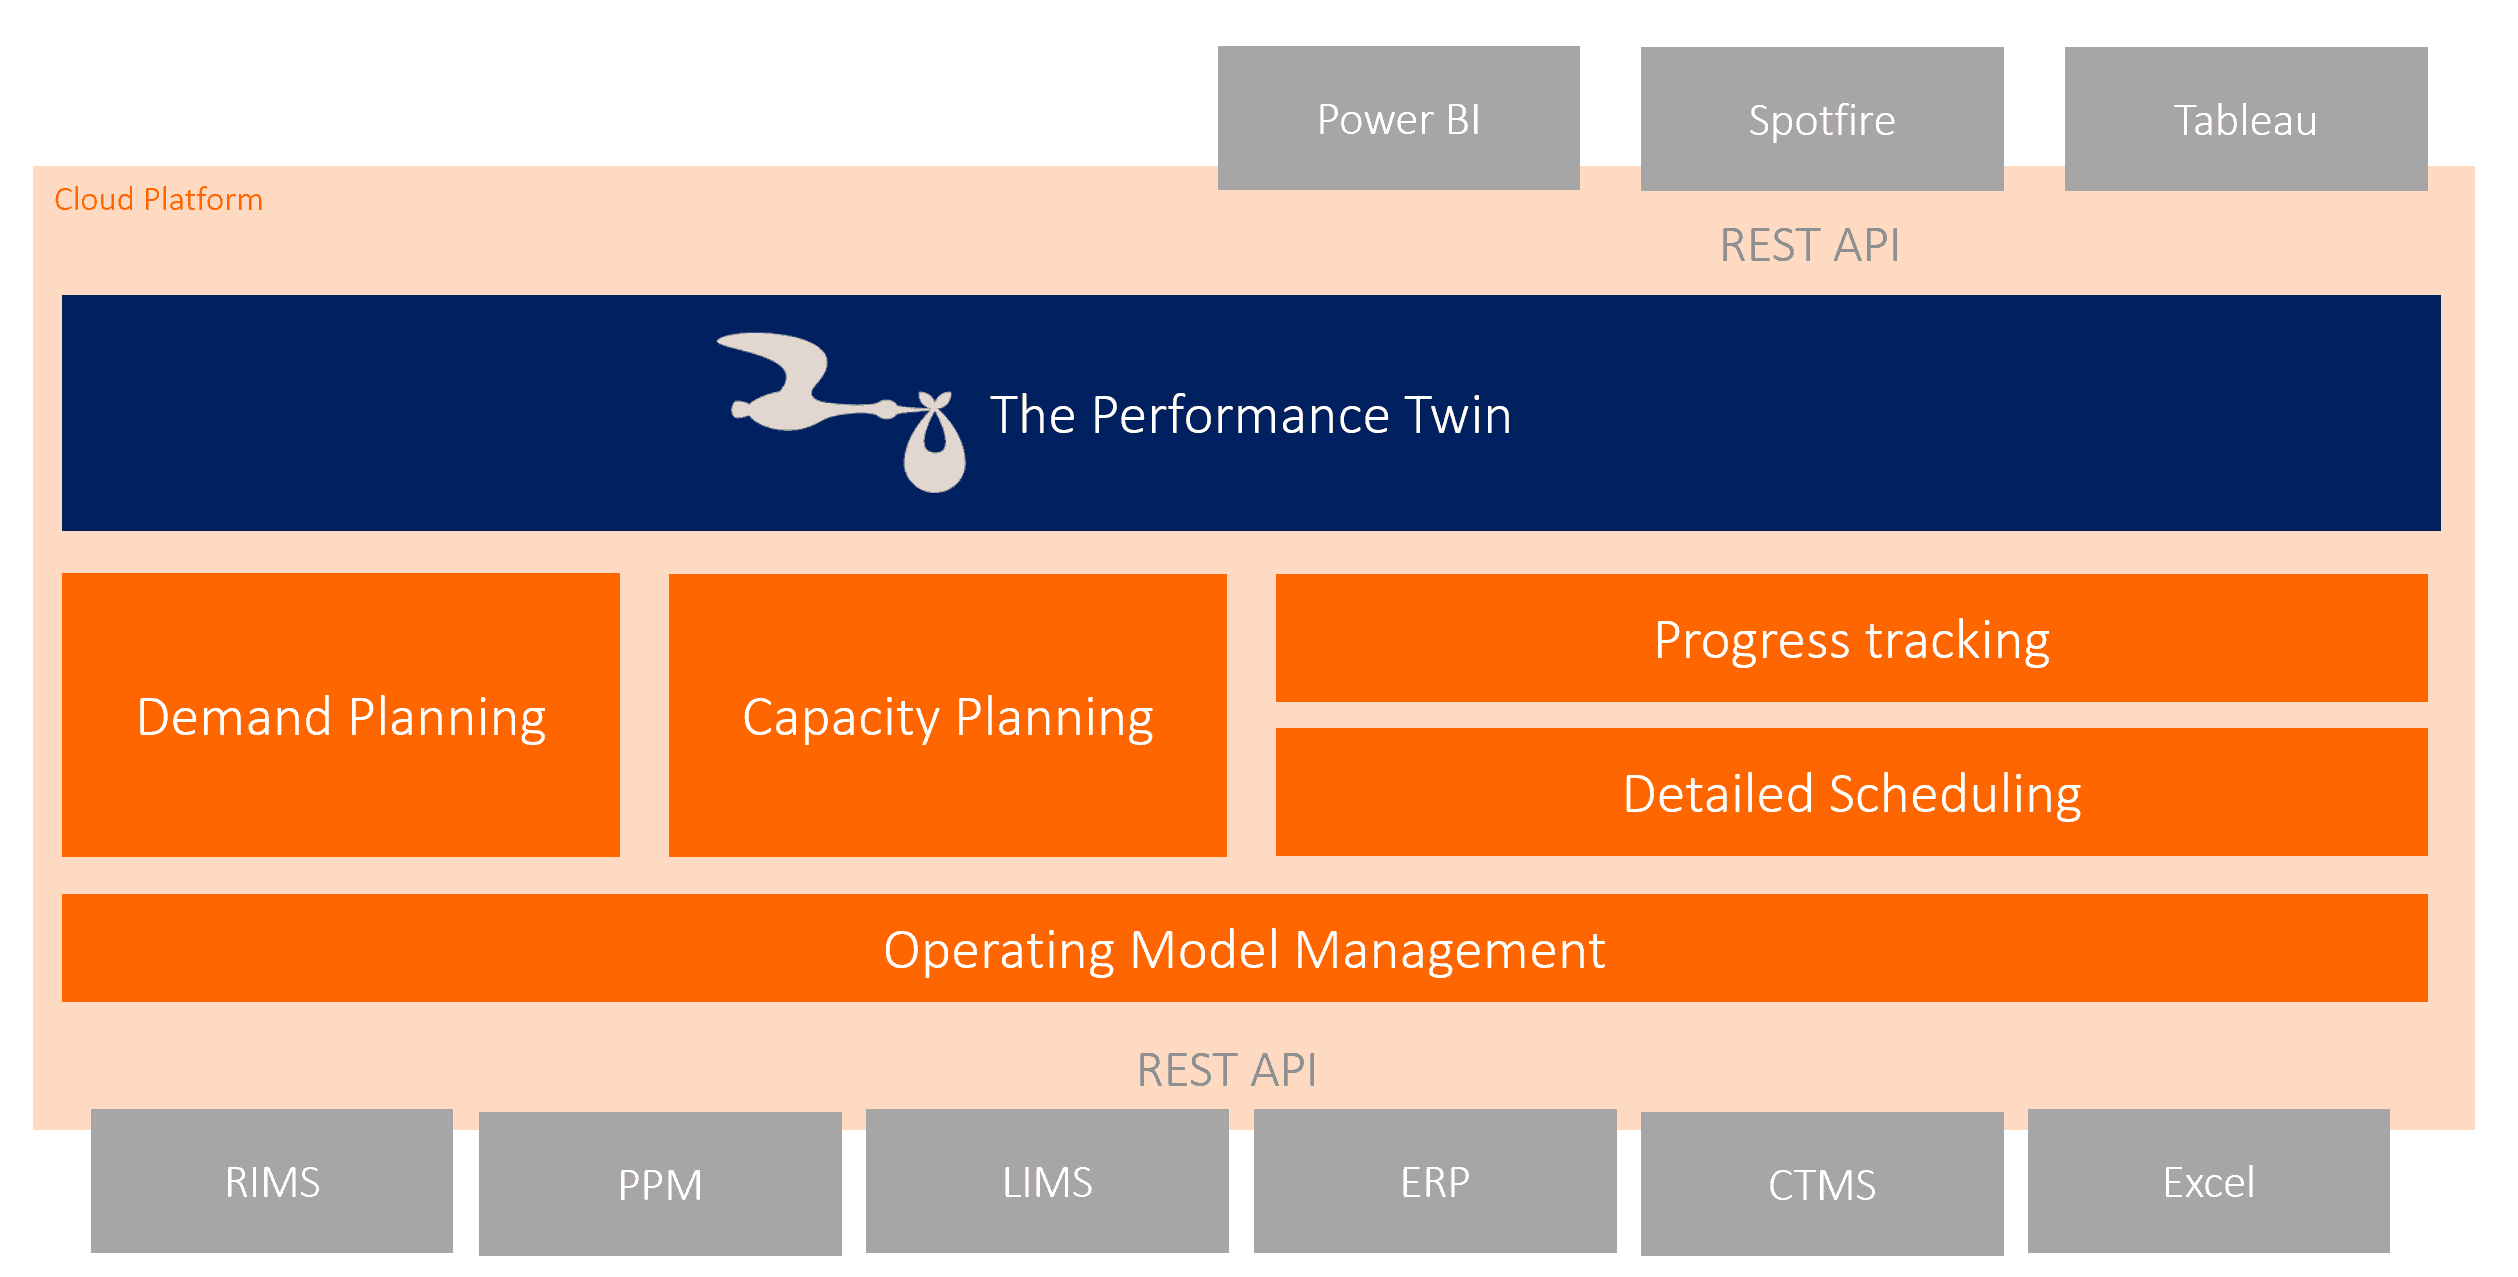
Binocs Performance Twin – the digital twin for your QC and R&D lab
May 21st, 2019 was a big day for us, not only because it was the first day of the Binocs user meeting. It was also the day on which we unveiled our newest component: The Binocs performance Twin.
The Binocs Performance Twin is a configurable platform that brings all performance data in one single data hub that can be made accessible to all users. With the first release, the performance twin came pre-loaded with a set of out-of-the-box dashboards and performance KPIs for QC and R&D labs.
With its Easy-of-use and one-click insights, the Binocs Performance Twin brings information to all layers and functions in the organization.
What is a Digital Twin?
If you have been exploring the Digital Transformation hype, for sure, you stumbled on the term Digital Twin. Digital twins are virtual replicas of physical objects that data scientists and business users can use to run simulations, prepare decisions, manage operations.
How Binocs becomes your organization’s Digital Twin
Unlike the physical world, which shows you the picture of the present, digital twins can review the past and simulate the future. With the demand, capacity and workload analyzers, Binocs already offers a digital twin for the planning processes. However, to evaluate your organization’s performance, you need more context and also pull in other aspects of your operations such as first-time-right, compliance and customer service data.
That’s what the Binocs Performance Twin brings to your organization: presenting all performance information in compelling dashboards and support you with visual management in your Tier 1-2-3 meetings and other operational/tactical business interactions.
Data quality: a critical part of how we make the performance twin sustainable?
When reading the above, what’s new? You probably use Excel sheets or repeatedly upload data sets in a suite of tools to make reports.
We have seen many times that this approach is not sustainable. Wrong data leads to immediate distrust.
The Binocs Performance Twin provides a set of features that help to ensure maximum data quality at all times:
- Advanced data science: before pulling datasets into Binocs, we apply a variety of data science techniques that filter bad data.
- Transparent data modeling and semantics: you map all business rules and exceptions in a comprehensive way that remains transparent over time.
- Audit trail: Unlike other applications, we don’t just upload and overwrite data in Binocs. With advanced data synchronization, we can reconstruct what has changed and what is new. This way we increase data quality and integrity, which is needed to build trust for the users.
- Snapshots: Binocs allows you to take periodic snapshots of your datasets. This way you can monitor the data trends as well as detect unexpected changes in data sets, which might be due to data quality issues at the source.
Integration with BI tools
Data scientists can use tools such as Tableau, Spotfire and Power BI for advanced analytics on the Binocs Performance Twin datasets. The Binocs REST API gives them direct access to datasets that Binocs already processed on data quality and data integrity.
Out-of-the-box: Visual Management for QC Labs and R&D teams
While supporting implementations at clients such as Pfizer, GSK, Merck and UCB, we gained insights in how Binocs could support Visual Management and Performance Dashboards. We canned these insights in out-of-the-box KPI reports that will be immediately available in the Performance twin.
Let us raise the veil a little bit:
- Different dashboards are created to report on a specific process, such as Compliance, Customer service, First Time Right, Efficiency, …
- Depending on the management level the user enters the dashboard at the correct organizational level with the ability to drill-down where needed
- Users get immediate insights on targets and KPI trends
Let us show some examples:
First time right
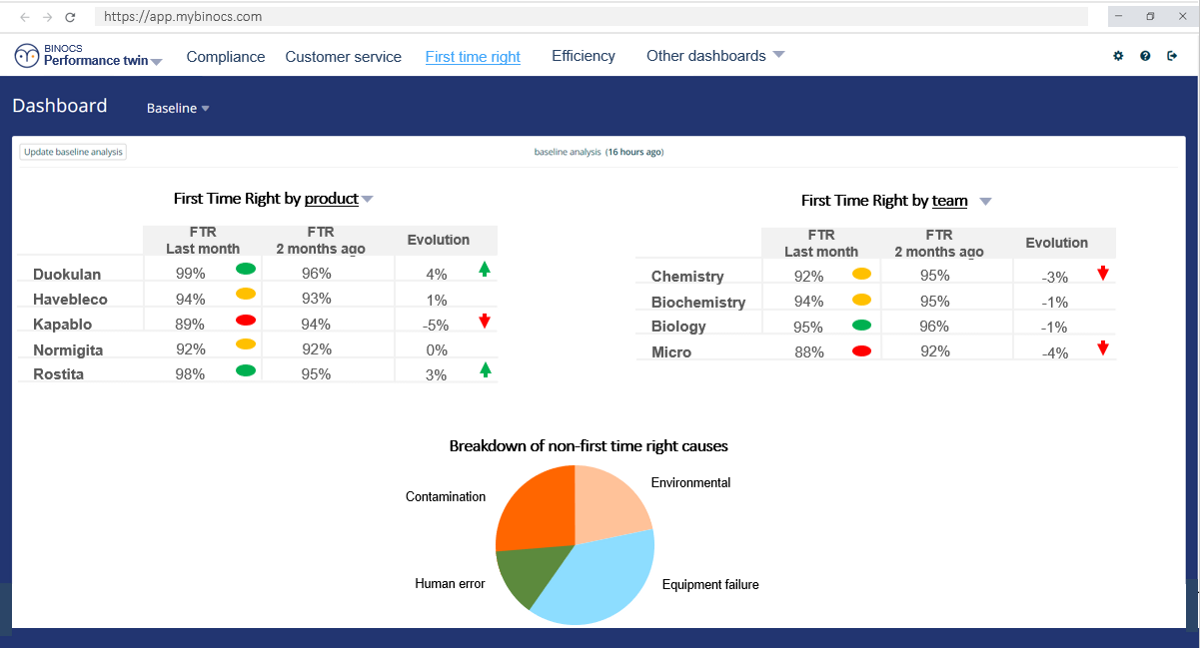
- A manager sees immediately which teams are underperforming and which products are impacted the most.
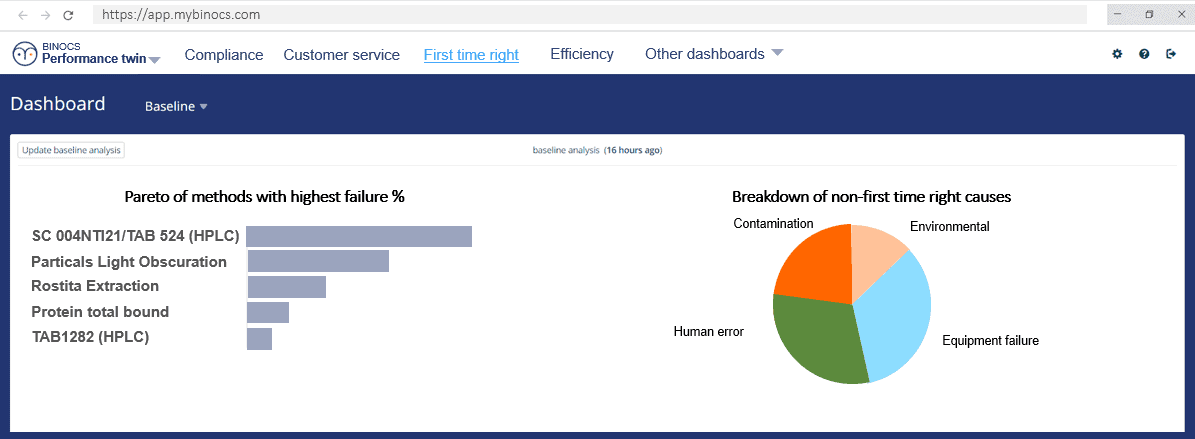
- On the team level, you immediately see the activities that are causing most of the failures and what are the main reasons for the failures.
QC efficiency
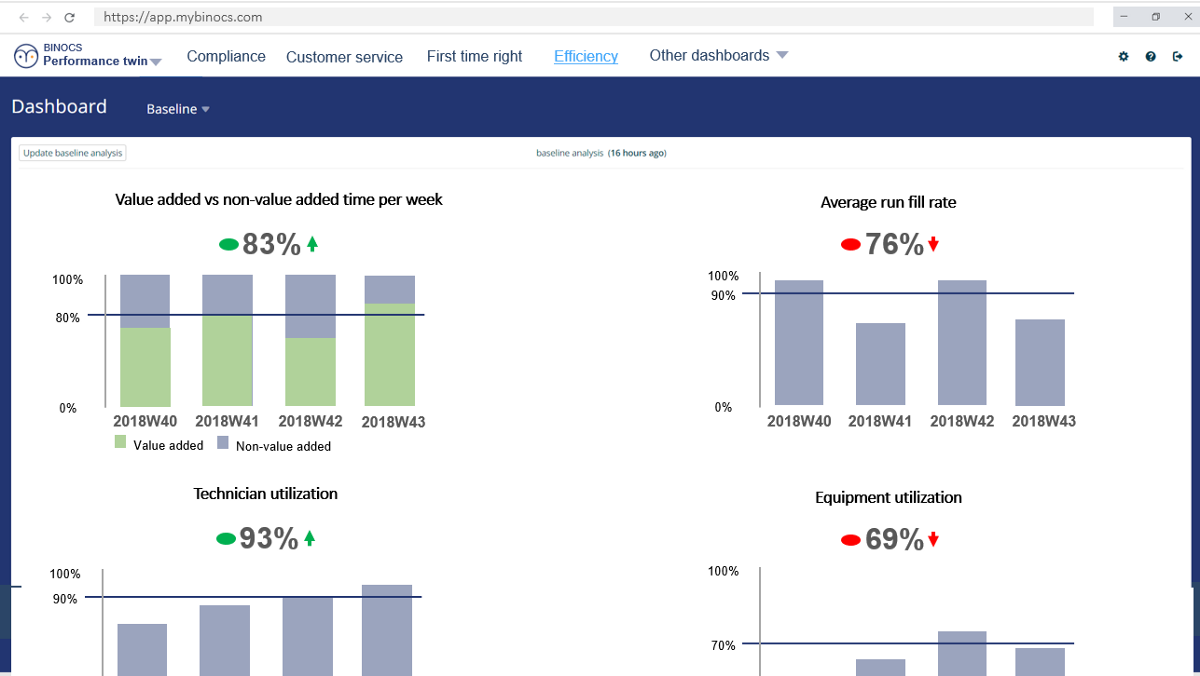
- On the management level, you immediately see four KPIs in one overview table. How much value added work is performed per team, what’s the average campaign fill rate and are the teams utilizing their analysts and equipment efficiently.
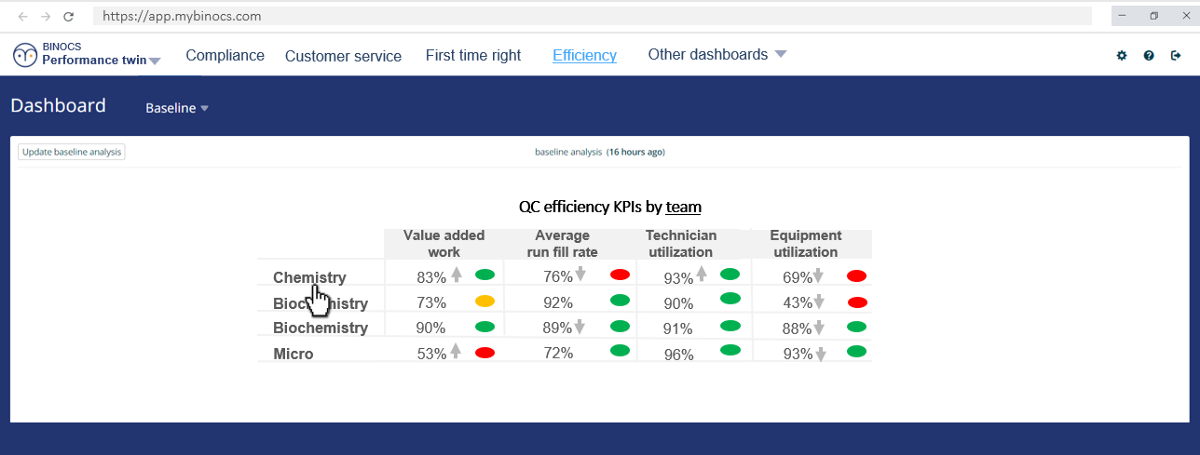
- Drilling down to team level shows the KPI trends.
Customer service
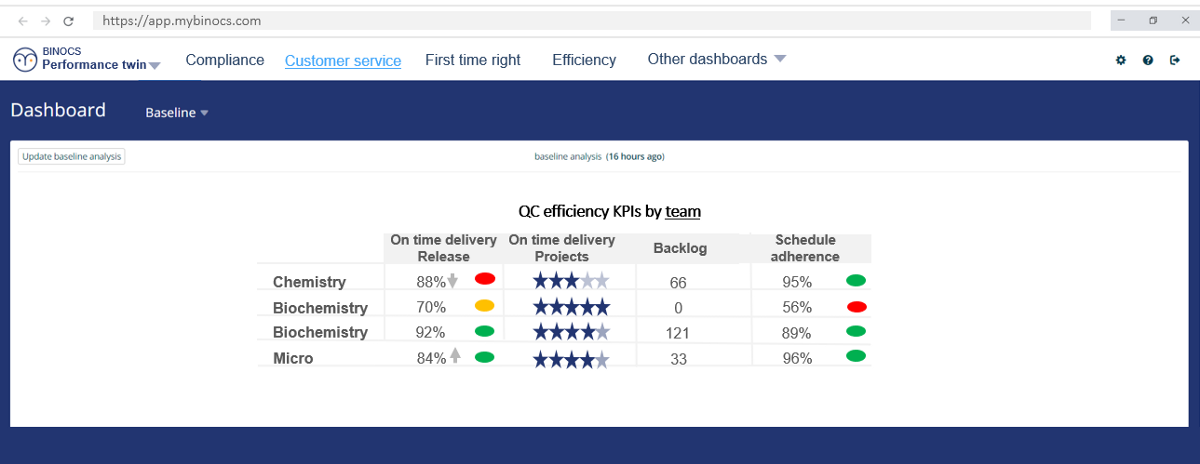
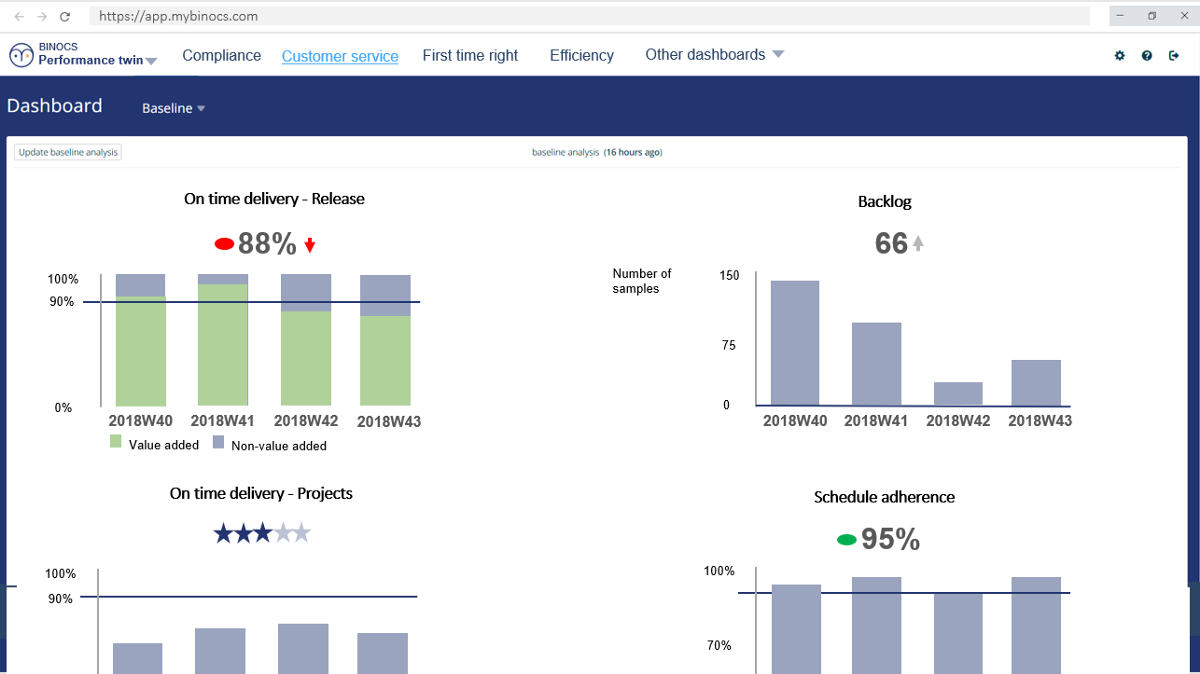
- In a similar way, Customer service KPIs are shown on the management level. Are teams delivering on time for Release and Projects? Which teams have a lot of backlogs? Are teams adhering to the schedule?
- Drilling down to team level shows the trends and more details.
That’s not all
This is only a sneak peek. We’re still adding to and refining the KPIs and reports. But if you’re curious:
- Want to discuss this in more detail? We are happy to have a Binocs chat.


