E2E visibility on your R&D operations

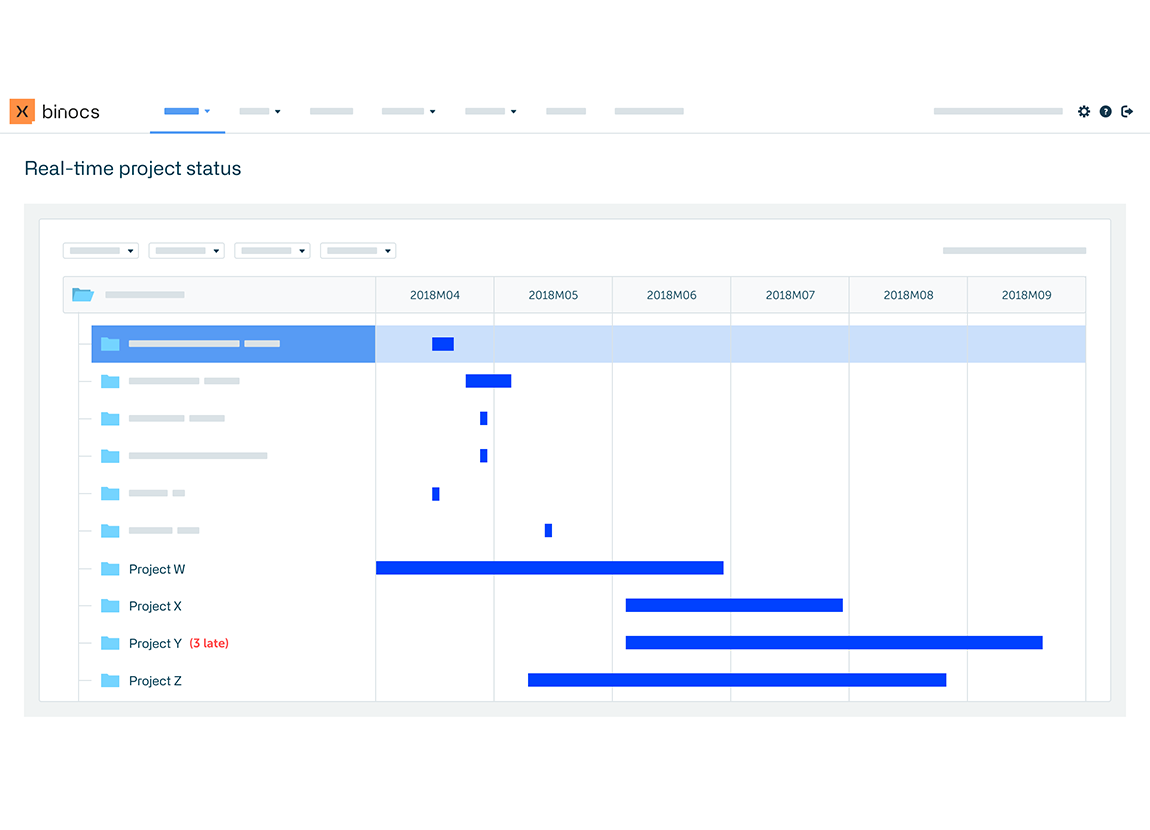
Organize your entire project portfolio in one system to gain a clear overview of all R&D planning activities.

Integrates with your PPM tools

  • R&D operating model: automatically derive capacity requirements from the Project Portfolio Management System (PPM) using the R&D operating model.
  • Add operational layer to PPM library: this operating model is a mirror of the PPM library but adds an operational layer below the work packages. It’s the benchmark of how an R&D department works, its lead times and standard workload.
  • Generate demand automatically: Binocs generates resource capacity requirements automatically based on the operating model and specific project characteristics (e.g. bacterial vs. viral) repeatedly and on the fly.
Binocs Daily Schedule-Campaign Details
Binocs schedule image

Real-time visibility across project leads & scientists

  • Create visibility: when projects are added, changed, stopped or postponed it is visible to the organization and immediately reflected in capacity requirements.
  • Alert center & real-time feedback: Binocs uses a constraint based planning algorithm (resource availability and competence constraints) and raises alarms when activities cannot be performed within the requested timeframe. That means immediate feedback for project leads and scientists.

Immediate insights with ‘what-if’ scenarios

  • Identify root causes: Unabsorbed project peaks, not enough scientists or just a massive overload in the pre-clinical phases? Functions will see the root causes of resource capacity problems immediately in Binocs.
  • Identify the best way forward: propose realistic solutions and action plans to your team and your management. What-if scenarios are easy and fast, you’ll run most of them instantly yourself. No need to wait for the expert.
Binocs Utilization Rate bar chart
Binocs scheduling graph

Performance tracking and prediction made simple

  • Learn from the past: Binocs measures planning adherence as well as resource utilization and throughput.
  • See the future: Binocs will tell you what the expected planning adherence and resource utilization KPIs are for the coming weeks, months and quarters.

Binocs seamlessly integrates with

  • Excel
  • IBM AS 400 logo
  • Labvantage logo
  • Labware logo
  • Protime logo
  • Qlims logo
  • SAP logo
  • Starlims logo

Check out our free resources

  • Binocs White Paper: Ultimate lab planning guide

    The ultimate guide for lab planning and scheduling digitalization

    This comprehensive guide provides everything you need to know to successfully digitalize your laboratory planning and scheduling!
    Download now
  • Man uses a touch screen of a digital laboratory planning Gantt chart

    Gantt: optimizing pre-clinical delivery for R&D labs

    Exploring the use of project management tools for laboratory planning—Gantt charts to optimize pre-clinical delivery for R&D labs.
    Read more
  • Scientists in white coats operate computers in a lab, illustrating the role of digitalization in biopharma process development labs

    3 key challenges for biopharma process development labs, and how digitalizing their lab helped them: a use case

    Find out how a multinational company who already used Binocs in QC labs also digitalized their biopharma process development labs with Binocs
    Read more

Request a demo today!

Request your demo

More than 1500 labs use Binocs globally

  • Ajinomoto logo
  • Astellas logo
  • Avexis logo
  • Biomarin logo
  • FAVV logo
  • Ferring logo
  • Fresnius
  • GSK logo
  • Lilly logo
  • Lonza Logo
  • Merck logo
  • Novartis
  • Oxford Biomedica
  • Pfizer
  • PPD logo
  • Pro Kidney
  • Proximus logo
  • Seqirus
  • Takeda logo
  • UCB logo