Binocs Community Day 2024: Announcing our Next Leap Forward
We're thrilled to announce Binocs Community Day 2024 on October 17th in Brussels and NJ, a celebration of our users and peek at what's to come
Read more

Key performance indicator dashboards in QC are crucial as they enable lab personnel to see relationships between different metrics and make informed decisions about how to optimize lab performance. Based on actual usage statistics from the year so far, here are the 4 Quality Control KPIs that QC labs use the most to maximize the value of Binocs:
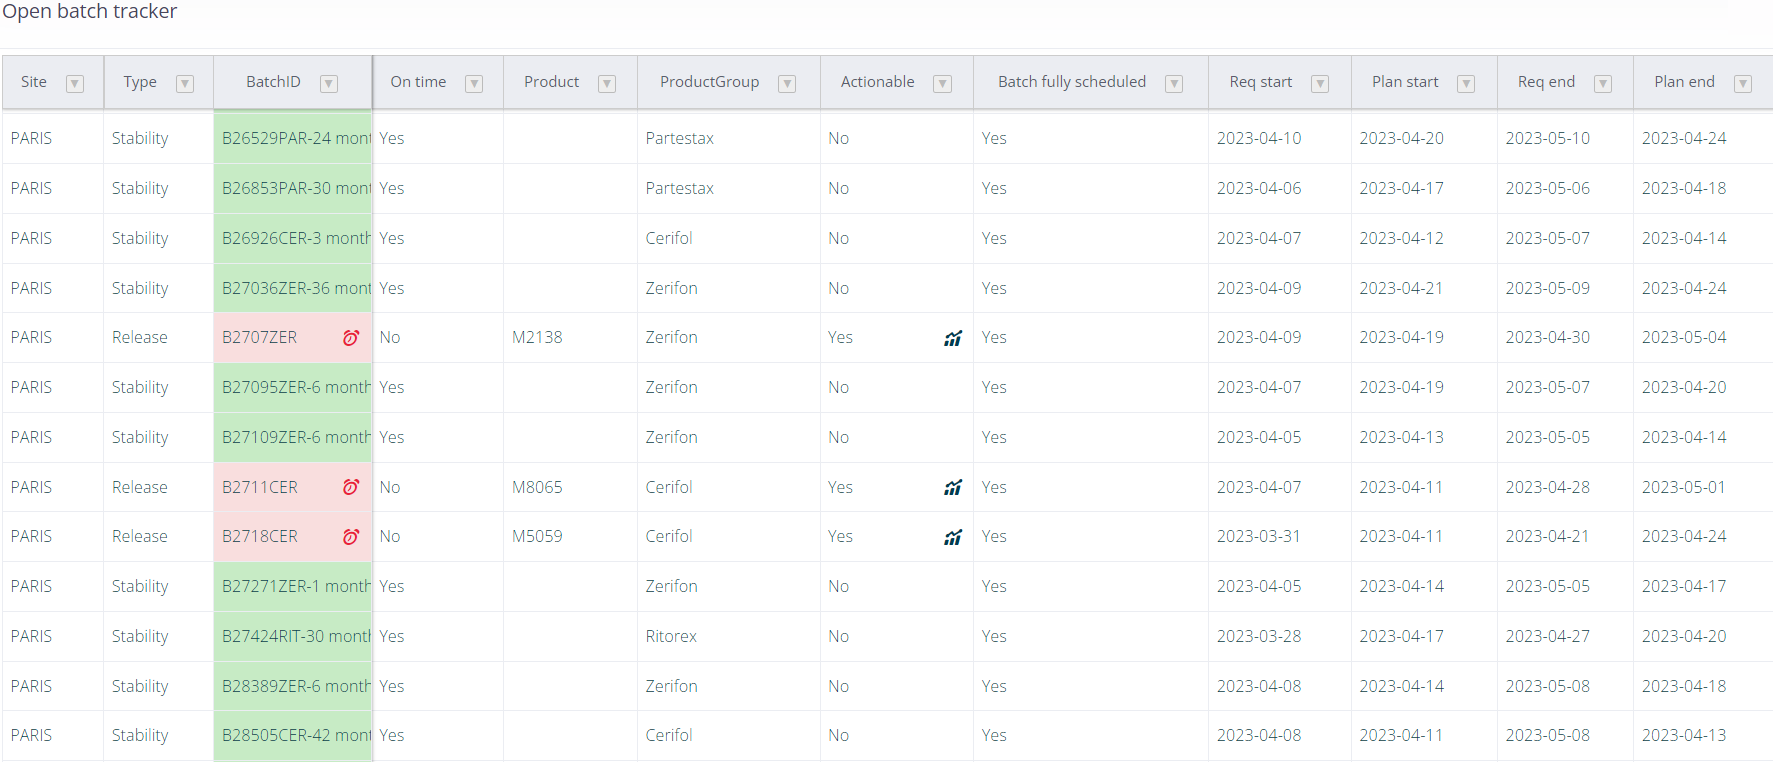
Pharmaceutical QC labs are incredibly complex environments with a potentially high throughput of batches, each requiring a range of different tests to be performed within very specific but narrow time windows. Without clear operational oversight, managers can rapidly lose visibility on resource priorities and delivery deadlines.
With the Binocs PBT dashboard, QC teams at companies such as Pfizer and Lonza are able gain at-a-glance insights into the status of all active release and stability batches moving through their labs. This allows them to immediately identify late and at-risk samples and tests, and dedicate critical attention and resources to high priority tasks, streamlining operations and helping to improve due date adherence.
Suggested PBT KPI metrics:
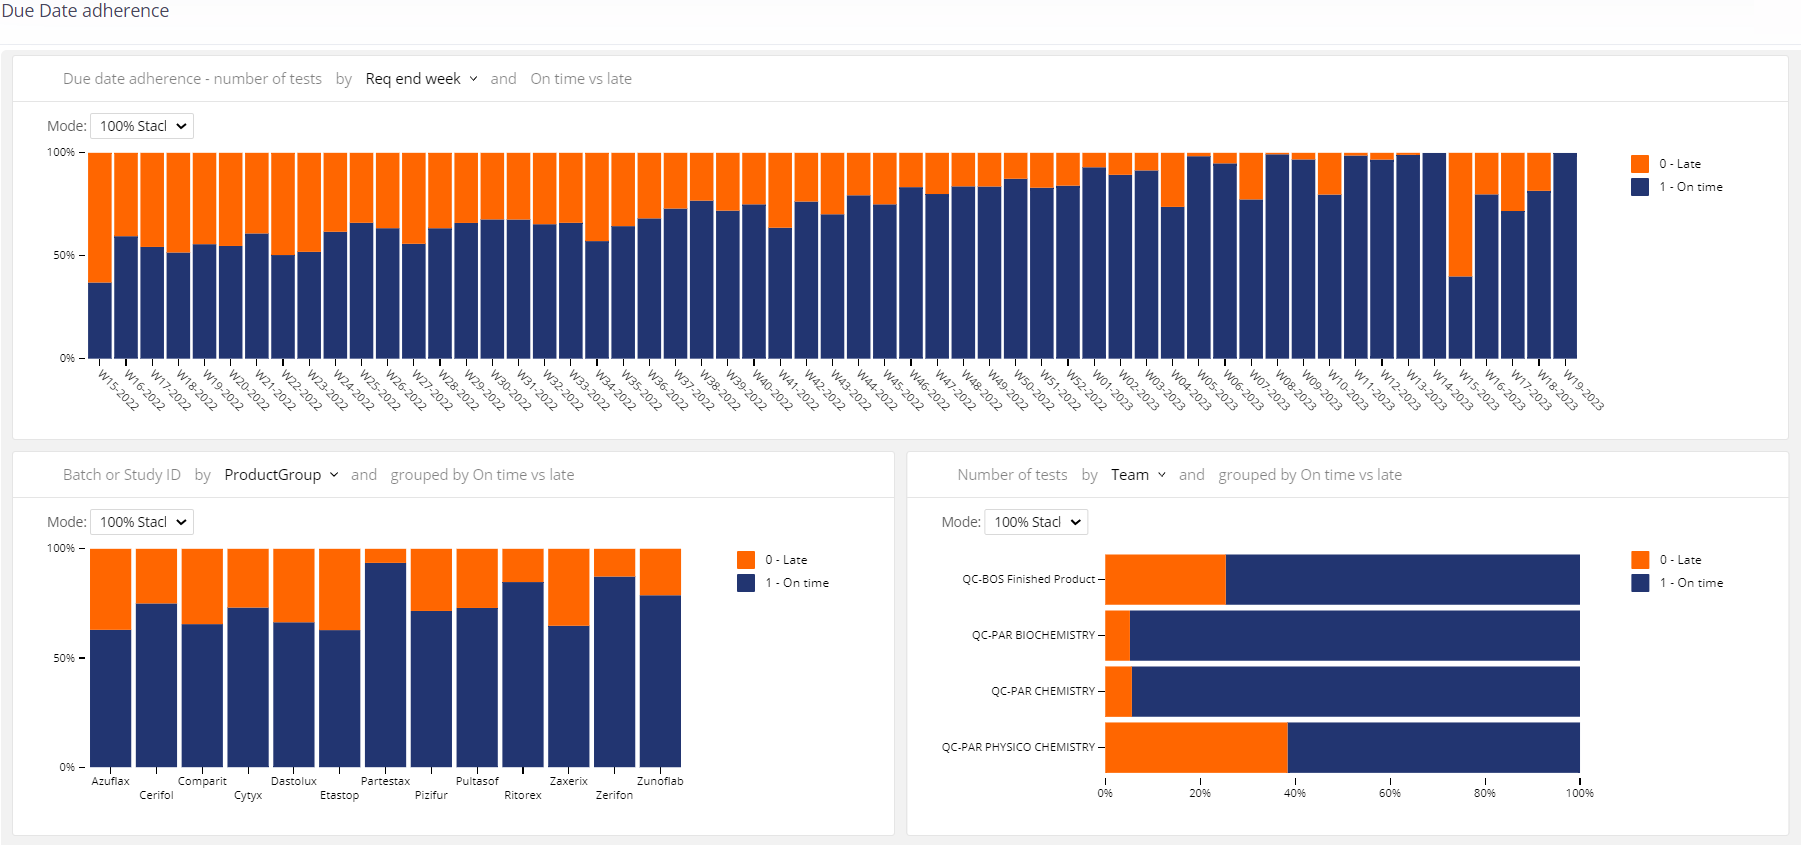
The due date of a test batch is defined before it is even received in a QC lab. Because the deadline is calculated to allow sufficient time for downstream processes to be completed ahead of delivery to market, a delay in one batch test can cause delays in subsequent tests. If the overall product release schedule is delayed even slightly, it can have significant impacts on the rest of the delivery supply chain, with associated cost implications.
That’s why companies like Eli Lilly and Merck Group use Binocs’ dedicated DDA dashboard to gain a clear and quantitative understanding of the situation in their QC labs! By identifying barriers to adherence, Binocs helps QC departments to plan suitable resolutions and enhance their value within the product release chain by reducing potentially costly impacts on the wider organization.
Suggested DDA KPI metrics:
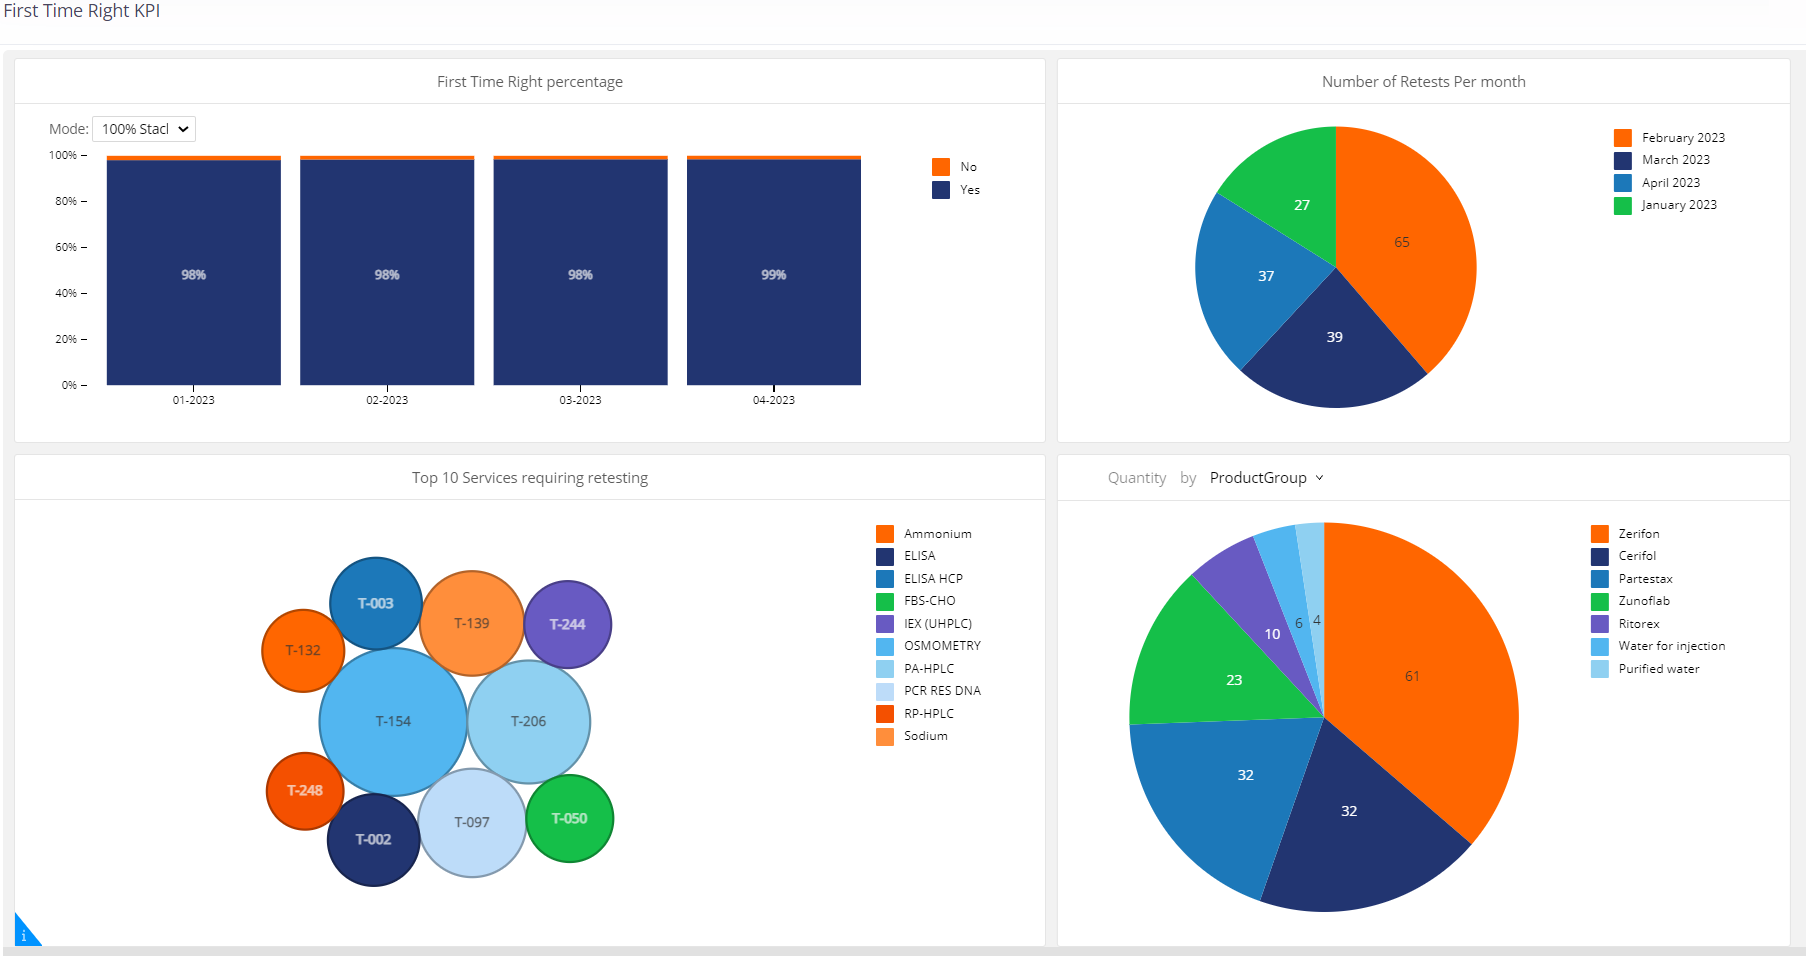
A certain amount of retesting will always be required in QC labs, however each time a batch needs to be retested it can create bottlenecks and delays that have significant consequences for on-time delivery and service levels. As such, QC managers strive to reduce the rate of deviations and other issues to minimize the amount of avoidable retests in their labs. For this reason, it’s vital that they have clear visibility on their analysts’ first time right rate and can work towards achieving and maintaining sustainably low retests levels.
With the Binocs FTR dashboard, companies including Astellas Pharma and Sandoz are able to track monthly retest metrics to identify teams, methods or products that are failing to meet targets and take immediate action to mitigate bottlenecks or take preventive measures to avoid similar problems in the future. By monitoring on an ongoing basis, managers can evaluate the impact of their corrective actions and quantify their lab’s overall effectiveness.
Suggested FTR KPI metrics:
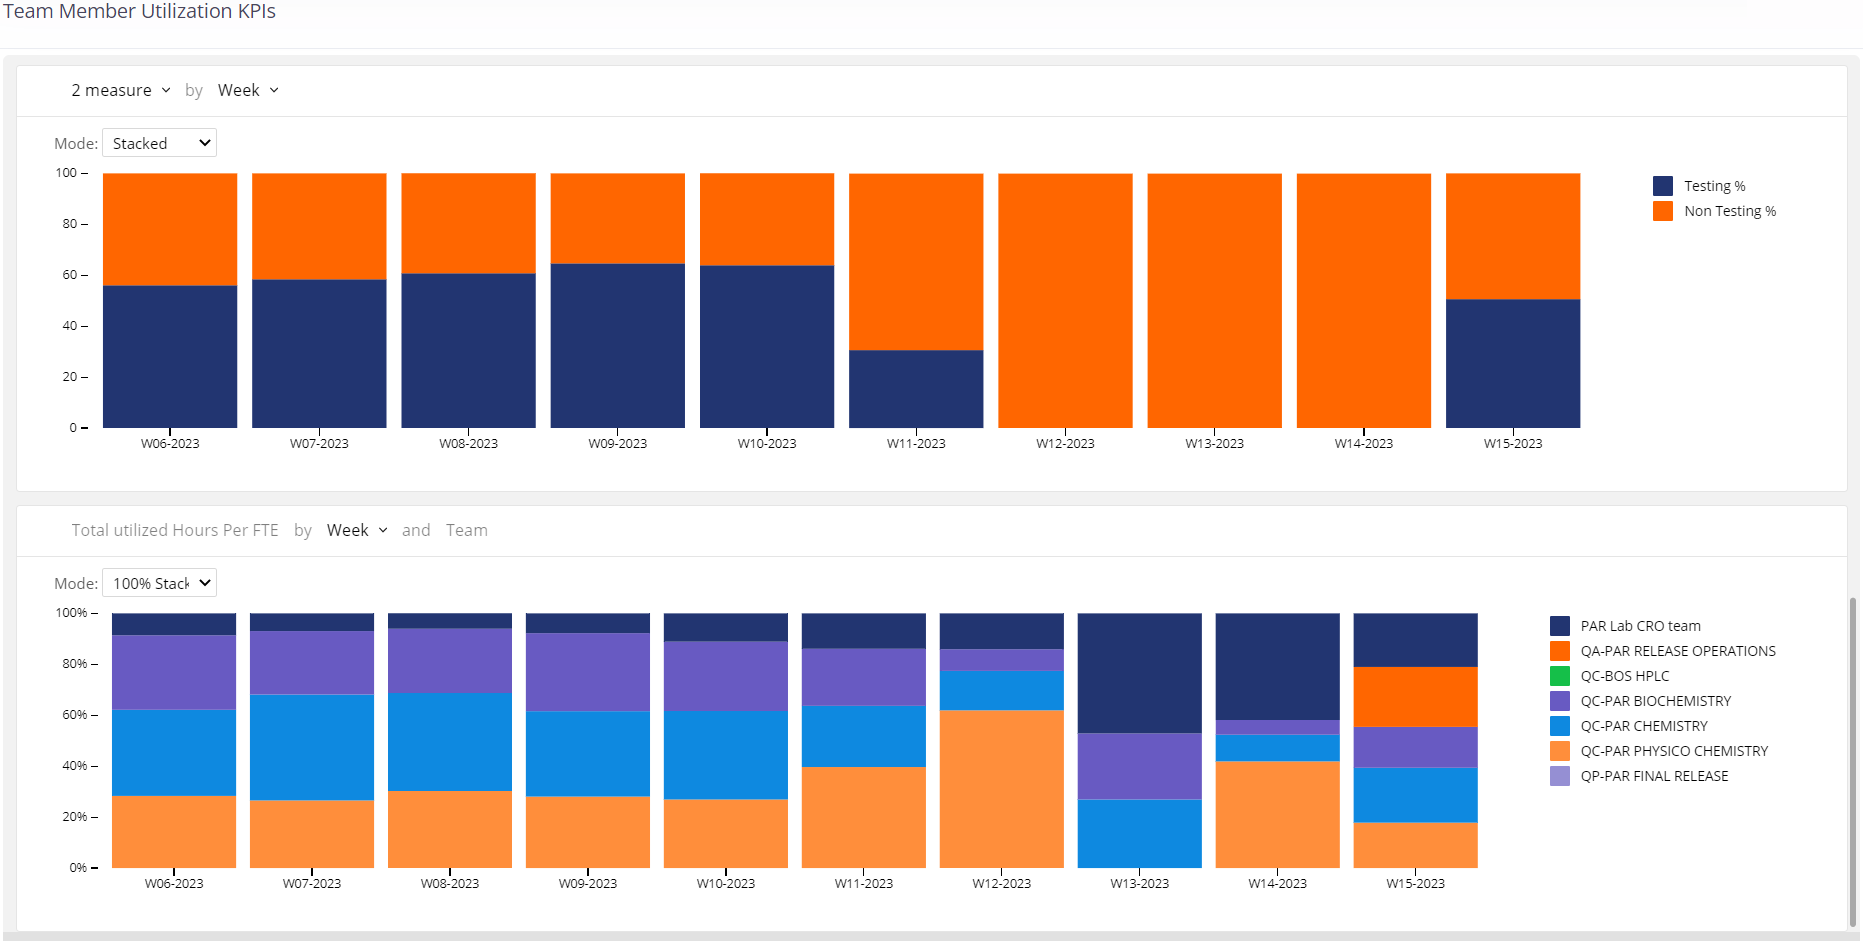
In any business setting, it’s vital to optimize the time spent on different types of task so that revenue generation and value-add activities can be prioritized wherever possible.
That’s where this Binocs dashboard come in: companies including Biomarin and Oxford Biomedical use it to enhance their asset utilization by monitoring the nature of the activities being performed, including the amount of staff and equipment time being dedicated to each type of task. With clear visibility on past and projected asset utilization, management can adjust workload distribution to help achieve an optimal balance.
Suggested utilization KPI metrics:
Are you interested in learning more about the KPI reporting and other features offered by Binocs to help support QC lab operations? Reach out for a chat today!