Enhancing lab efficiency via co-creation: new Binocs landing page
At Binocs, we’re always looking for new ways to improve the platform user experience and we dedicate significant time to consultation with clients to ensure our product solutions deliver value. In this blog post, I highlight the latest step towards our goal of enhancing lab efficiency via co-creation by outlining the user-guided process we followed to develop our newest product feature: the personalized Binocs landing page.
In a rush? Here are the 3 key takeaways
- 👉 Binocs employs co-creation principles to ensure new features are fit-for-purpose and add value to widest possible user base
- 👉 Our Product team follows a 3-phase approach to co-creation: assess user needs, monitor user analytics, conduct user testing
- 👉 This has resulted in the design of our new personalized landing pages for lab analysts and lab planners; additional user-specific designs will be developed in the future
We’re dedicated to continuously improving the Binocs platform to provide our users with the best possible experience. To achieve this, we place the users themselves front-and-center in our development plans. That’s why we’re thrilled to unveil our latest product innovation: the personalized Binocs landing page. This new addition to the Binocs user experience (UX) introduces functionality co-designed with lab analysts and schedulers to ensure that we deliver real value to the people who rely on our SaaS (software as a service) platform every day.
Our approach to co-creation follows 3 main phases:
Co-creation phase 1: user needs
Since 2018, users logging into the Binocs platform have been presented with a standard landing page that contains a default dashboard of useful charts and graphs. This feature was originally designed to provide users with quick and easy overview of information relevant to their daily tasks, however Binocs has evolved significantly since this feature was first introduced, both in terms of the functionality that we offer and the use cases of our customers.
In 2022 we identified that the default landing page was in need of an overhaul. Our excellent user community reported that they interacted less with the dashboard because the information it contained was either too detailed or not detailed enough, depending on the role of the individual user. Following consultation with key user stakeholders, our Product team confirmed that significant additional value could be derived from the landing page. Being a SaaS platform, we always aim to find common ground across our customer base and their daily realities. For the landing page this resulted in the following common requirements:
- Keep it relevant by displaying different information for different user types
- Ensure that the time frame and granularity of the data are tailored to the user type
- Allow easy access to quick links for navigating directly to the most visited areas of the system
- Provide a hub that summarizes relevant Binocs modules and includes calls to action as needed
- Keep the interface streamlined and visually appealing
We actively listened to our users, ensuring that their voices and insights were heard, analyzing what they have in common and incorporating those elements into the feature’s new design. This collaborative approach enabled us to understand their specific needs and deliver a solution that truly resonates with the widest possible user base.
Co-creation phase 2: data analytics
To gain deeper insights into user activity and preferences across the entire Binocs system, we conducted rigorous data analytics. By examining how users engage with the core product features, we both identified the user interface (UI) areas that generate positive interactions and mapped out the most visited sections of the platform. It also highlighted some high-value Binocs features that, despite their usefulness, were receiving less traffic than expected. This helped the Product team to identify the best navigation options to include in the redeveloped landing pages.
This user insights process also isolated two key user types with distinct patterns of behavior:
- Lab analysts, whose usage centers primarily on the Schedule, tracking and executing their own activities;
- Lab planners, who (unsurprisingly) spend more time interacting with team-level Schedule views, as well as the Campaign Manager, the Demand management feature, and querying our extensive reporting and analytics suite.
Based on these data-driven metrics, the Product team was able to produce prototypes for new landing page dashboards, tailored to these two use cases, and with a UI that was both visually and functionally enhanced to reflect usage patterns. We believe we found a feature that benefits our wider user population.
Co-creation phase 3: user testing
Early in 2023, we rolled out a beta testing program to user test the prototype landing pages with lab analysts and planners at five key clients. The program lasted eight weeks and involved both direct user feedback and further data analytics to identify where additional refinements could be introduced to maximize utility and value.
This collaborative effort allowed us to validate the feature’s performance in real-world scenarios, making it even more tailored to the needs of our users. Once beta testing teams had adopted the new landing pages and confirmed their utility, many of the pilot sites opted to implement the feature in other teams. Since this pilot phase, no teams have reverted to the legacy landing page design, further validating its effectiveness and the value it brings to daily operations.
Introducing the new Binocs landing pages!
Published on July 8th 2023, we’re delighted to confirm that the first two personalized landing page dashboards are now live on Binocs! As a result of the extensive user consultation process, we feel confident that this will make life easier for both lab analysts and lab planners by placing the most relevant information and navigation tools at the heart of the Binocs UX.
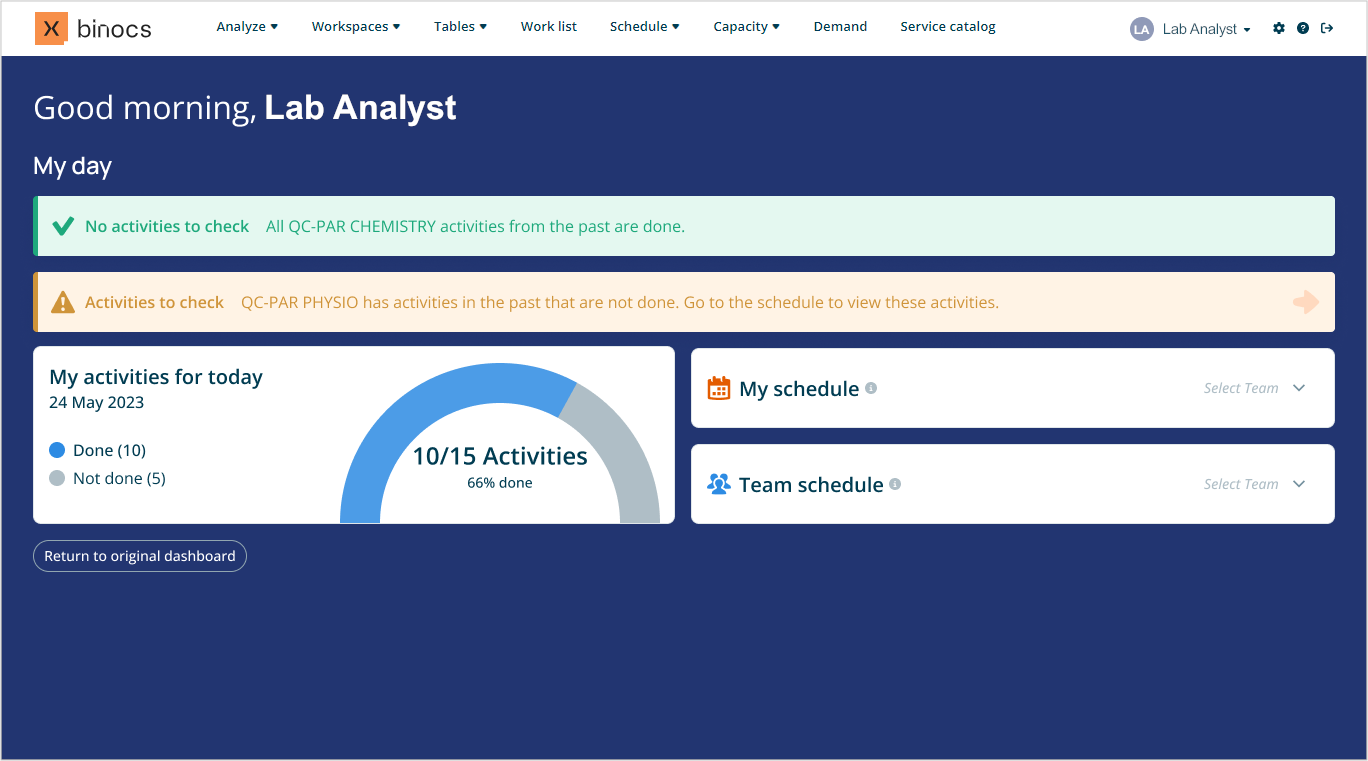
As soon as they log in, Analysts can now see what they need to do today, with a graphical overview of their planned activities and quick links to their personal schedule. Visual notifications are also displayed to alert the user to any unexecuted activities from the past that still need checking.

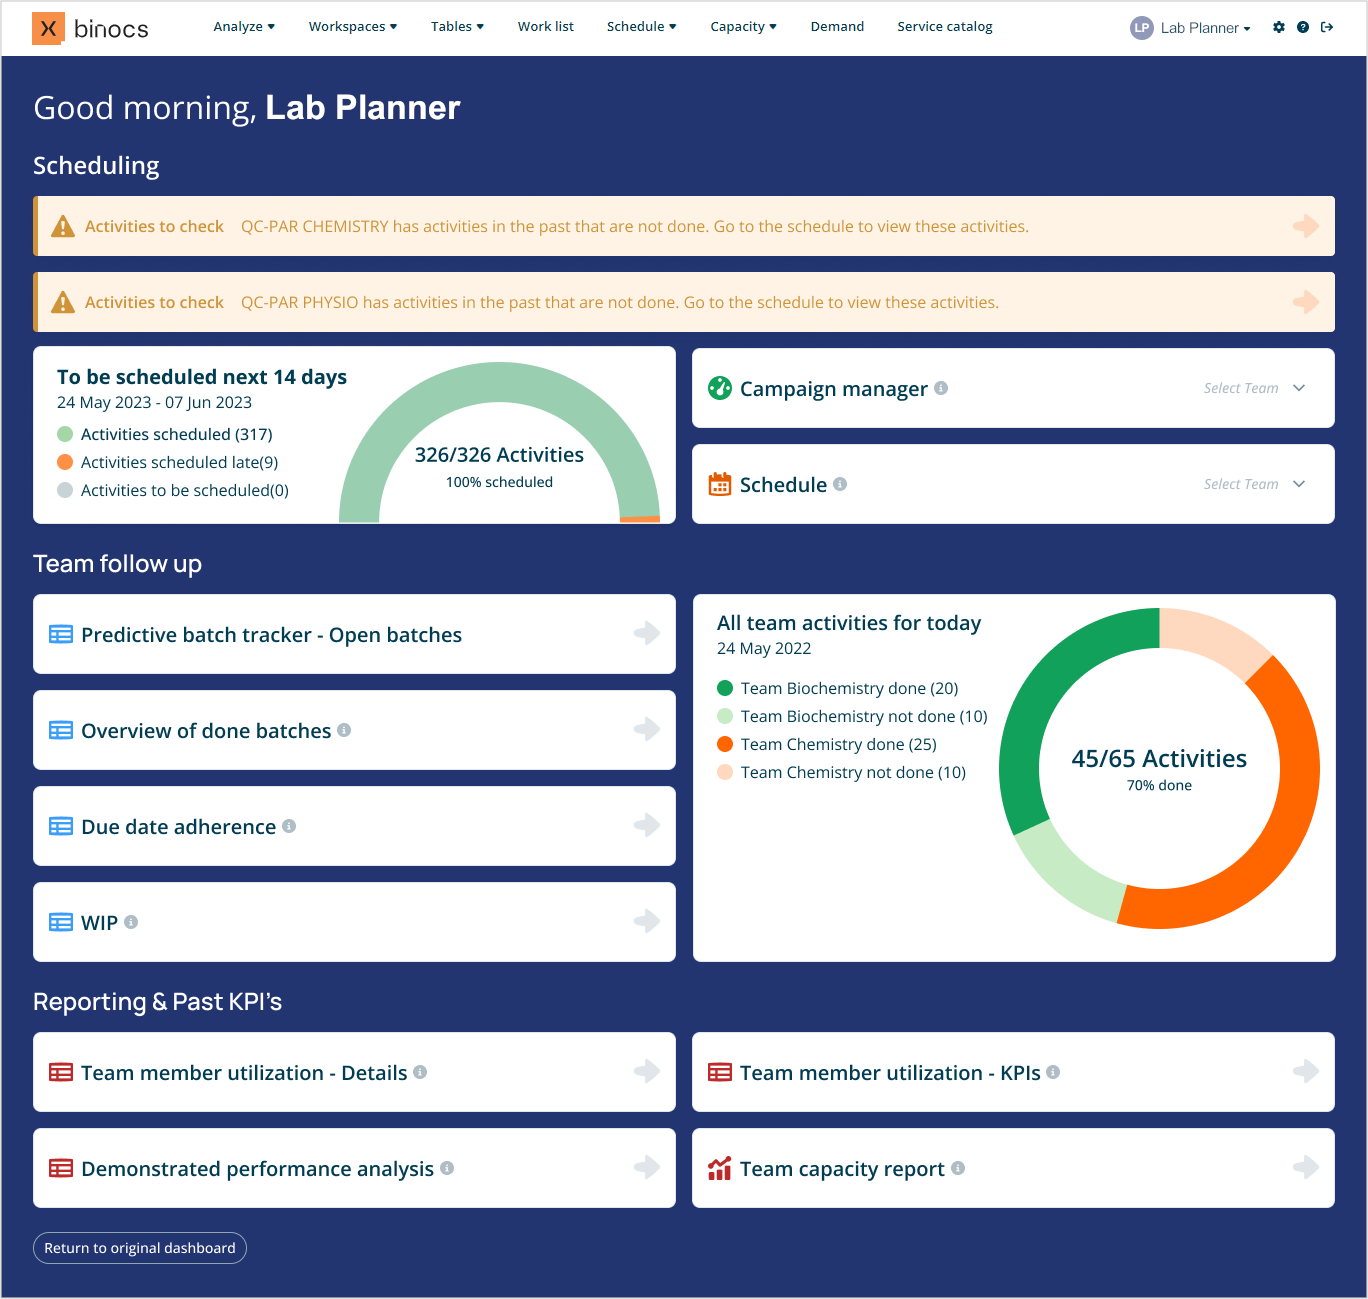
For Planners, the dashboard prioritizes an overview of the status of their team schedule(s) and a graphical summary of planned activities for their team(s), as well as quick links to their daily workspaces and KPIs. As for Analysts, alert messages are displayed if there are unexecuted activities from the past that need checking, except this covers activities across all team members.
Additional graphs are also included to provide a visual indication of all scheduled tasks for the next 14 days and to show the progress of their team(s) in executing activities.

These dashboards are just the beginning: over the course of future product releases we will make additional refinements based on ongoing user analytics and will also conduct further user consultations to identify other user types for whom tailored landing pages would add value.
Our approach to co-creation is designed to maximize the business value of the Binocs product by identifying enhancements that will help users work more efficiently and reduce the time spent on unnecessary navigation, searching and filtering. By actively involving our users in the co-creation process, we have harnessed their invaluable insights to optimize daily operations and deliver a seamless user experience to support enhanced laboratory efficiency.
Are you interested in joining the vibrant Binocs user community to enhance your workflows and increase productivity? Why not reach out for a chat today? Together, we can continue to revolutionize the way work is done and drive operational excellence!
Let’s get to know one another!
Related content
-
The Binocs team has been hard at work to introduce new functionality that will take user experience to the next level.Read more
-
Visual management in the lean lab of the future
Clear communication is critical for pharma production and QC. Discover how implementing visual management for lean labs can make life easier!Read more -
4 KPI dashboards that every QC lab should use
KPI dashboards in QC are crucial as they enable lab personnel to see relationships between different metrics and make informed decisions about how to optimize lab performance. Based on…Read more
Ruben Bäumer
Ruben is the head of Product and Engineering for Binocs. He started out combining engineering and data science in different sectors such as supply chain, transport and power systems. Later, he transitioned to product management, even before having the official title product manager, he learned later on. He grew his experience by building and launching products for both B2B and B2C customers in the energy sector. He evolved to leading data science and software teams, with the same passion to create technology products people rely on and enjoy using every single day.


