How to analyze material flows using process mining techniques
Process mining is a hot topic in our industry—and has been for several years. I‘ve seen early process mining solutions skyrocket in valuation over this time period. This type of growth and valuation boost can only be based upon proven value delivery. There is no doubt in my mind that process mining techniques have delivered value in process analysis. And so, for readers who are new to process mining, I’d like to provide a quick introduction.
In a rush? Here are the 3 key takeaways:
- → The analysis performed by process mining is across many, many transactions and includes key information such as the Case ID, Activity ID and Time Stamp. You can use the descriptive remaining information for filtering purposes.
- → Because process mining is focused on the order and not the object, there are some drawbacks to the use of process mining to analyze manufacturing lines and supply chains.
- → As with standard process mining tools, Axon can perform an in-depth analysis of the past performance of your supply chain to identify key areas of value leakage. AND, it can do even more!
With the advent of ERP systems, particularly SAP, companies started capturing transactions. These transactions are a record of when particular process activities are performed, by whom and on what.
Transaction capturing
For example, a transaction will capture the following information:
- Purchase Order 123456
- Issued by Trevor
- On 09-Aug-2023 at 12:26:31 GMT
- To Company XYZ
- For 2 printer cartridges and 3 reams of paper
- For delivery on 16-Aug-2023
- To the Bluecrux office in Mechelen
Another transaction may be that:
- Purchase Order 123456
- Received by Christophe
- On 09-Aug-2023 at 16:45:32 GMT
- From Bluecrux
- For 2 printer cartridges and 3 reams of paper
- For delivery on 16-Aug-2023
- To the Bluecrux office in Mechelen
In the process mining world, the key information is: the Case ID (PO123456), Activity ID (Issue PO, Receive PO) and Time Stamp (20210811 12:26:31 and 20210811 16:45:32). You can use the remaining information, which is descriptive, for filtering. For example, you can perform an analysis on only those purchase orders issued by Trevor. Among other things, it’s possible to mine process time information from the transactions. In this case: 16:45:32-12:26:31, or 4.316944 hours, is the process time from sending the PO to receiving the PO.
→ The analysis performed by process mining is across many, many transactions, resulting in an analysis like in the diagram below.
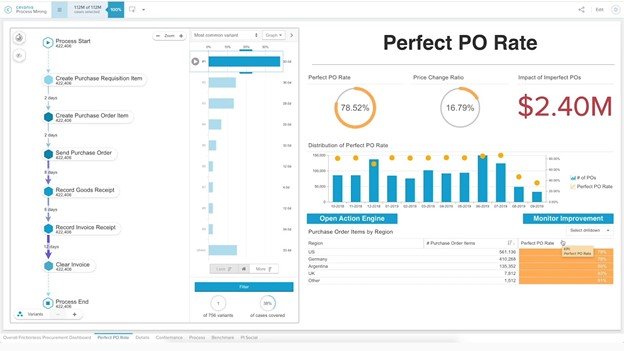
Source: (13) SAP Process Mining by Celonis – Frictionless Procurement – YouTube
ERP systems & process mining
In an ERP system, there are many processes driven by different types of orders—sales, recruitment, manufacturing, shipping, receiving, picking, packing. This is also true for the processes covered by the ERP deployment—procure-to-pay, order-to-cash, hire-to-fire, etc. You can analyze each of these processes individually, provided there is a unique case ID, activity ID and time stamp.
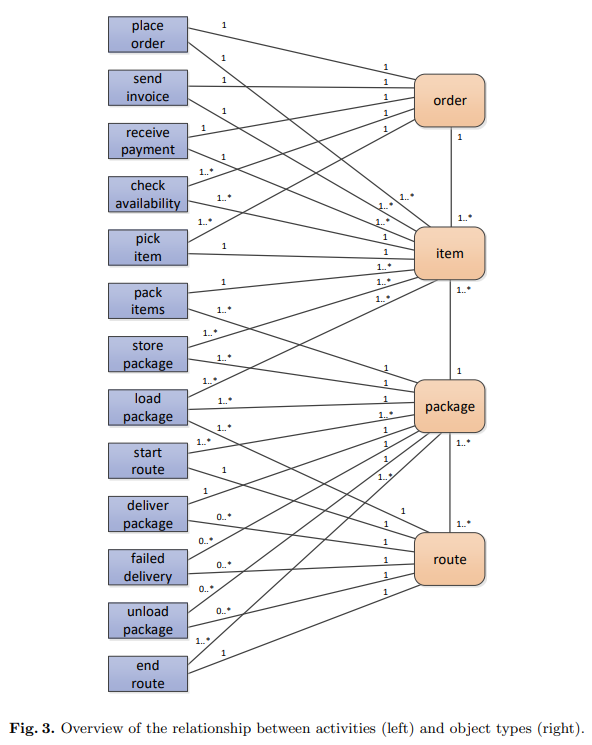
Here is the rub for analyzing manufacturing and supply chain processes: The object of interest is the material, not the order. In the procure-to-pay (P2P) example above, the order was being analyzed, not the material flow. Wil van der Aalst, the “father” of process mining, has written some papers on the issue of “Object Centric Process Mining.” Van der Aalst uses the case of a purchase order to illustrate the issue. Normally, process mining follows the order of activities, the blue column. In supply chain, we are more interested in the objects that the activities are being performed upon (the brown column).
I’d like to pause to acknowledge that companies can indeed generate a lot of value through process standardization and conformity, which lead to efficiency gains. The concept of time and motion studies is not new, as Frederick Taylor pioneered it in the early 1900s. What has changed, however, is that ERP transaction logs have replaced the stopwatch and clipboard. This has created a huge amount of data. You can analyze this data to improve the efficiency of the processes as defined in the ERP systems.
→ Because process mining is focused on the order and not the object, there are some serious and recognized drawbacks to the use of process mining to analyze manufacturing lines and supply chains.
‘Anonymous’ inventory
In ERP systems, there is an order to put material into inventory, and there is an order to take material out of inventory. But, there is no order to keep the inventory in stock. Hence, to process mining, inventory is “anonymous,” as it can’t be associated with an order ID.
This leads to a second problem, namely that incoming inventory is usually in much greater lot sizes than the outgoing inventory. So, how do you match the incoming and outgoing inventories, especially given that the put-away order and picking order have different IDs? And how do you determine time in inventory?
Material ID change
Many operations—machining, assembly, etc.—result in a material ID change. This is apparent from the diagram in the previous section.
Therefore, even if you can track the object ID, you need to understand the bill-of-materials (BoM), bill-of-lading (BoL), bill-of-distribution (BoD), etc., and all the routing information in order to track the material ID changes through a supply chain. Process mining tools do not understand this information. So, you are left with several links, but not a chain representing the connected links.
The forecast does not have a transaction ID because the forecast is an object, not a process.
Most companies are make-to-stock, with sales orders only accounting for about 5% of material movements. Replenished orders generate the other 95% of material movements. While process mining could use replenishment orders, safety stock (SS), re-order point (ROP), minimum order quantity (MOQ) and economic order quantity (EOQ) logic generate the replenish orders. Therefore, by using replenishment orders, you will have lost visibility to the demand picture, and consequently, the ability to use demand priorities to analyze the value stream flows.
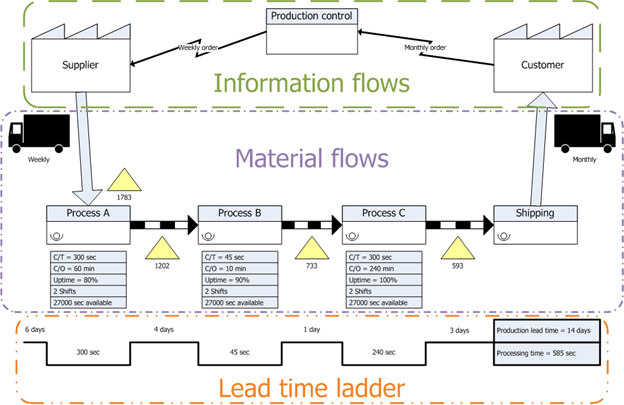
Anyone who has created a value stream map (VSM) of a production line or supply chain will know that an item will spend the vast majority of its time in a buffer of some sort, whether on a production line, in a warehouse or in a container. Not being able to analyze the time in inventory is a serious shortcoming of process mining in developing end-to-end supply chain VSMs.
Forecasting woes
We also know that the material ID constantly changes by going through machining, packing, unpacking, assembly, loading and many other activities and processes. Without being able to follow the material ID changes, and object ID in process mining terms, you have a link to the chain but not a manufacturing line and not a supply chain.
Many end-to-end supply chains have lead times of 9 to 18 months. They need forecasting to understand what is driving more recent purchase orders, manufacturing orders and replenishment orders. The vast majority of supply chain and manufacturing systems are make-to-forecast/make-to-stock. If you only use sales orders to analyze your supply chain and manufacturing, in most cases, you can only analyze the order-to-delivery process. Even if the end-to-end supply chain lead times are 9 to 18 weeks, supply chains need a forecast to understand more recent material movements.
→ In summary, because of these shortcomings, it is impossible to perform end-to-end value stream analysis of a supply chain using standard process mining concepts and tools.
Enter Axon
Axon also uses transaction logs for process mining, however it does so from the material ID perspective. Axon performs what Van der Aalst calls object-centric process mining. In addition, Axon uses key master data, usually stored in ERP systems, to perform the process mining across processes. More importantly, Axon uses fuzzy matching to link material flows across master data records and transaction systems such as ERP, MES, WMS, LIMS and other core enterprise transaction systems. This first step of data association is very important, as Axon links the data across the core systems and develops a graph model of the associations.
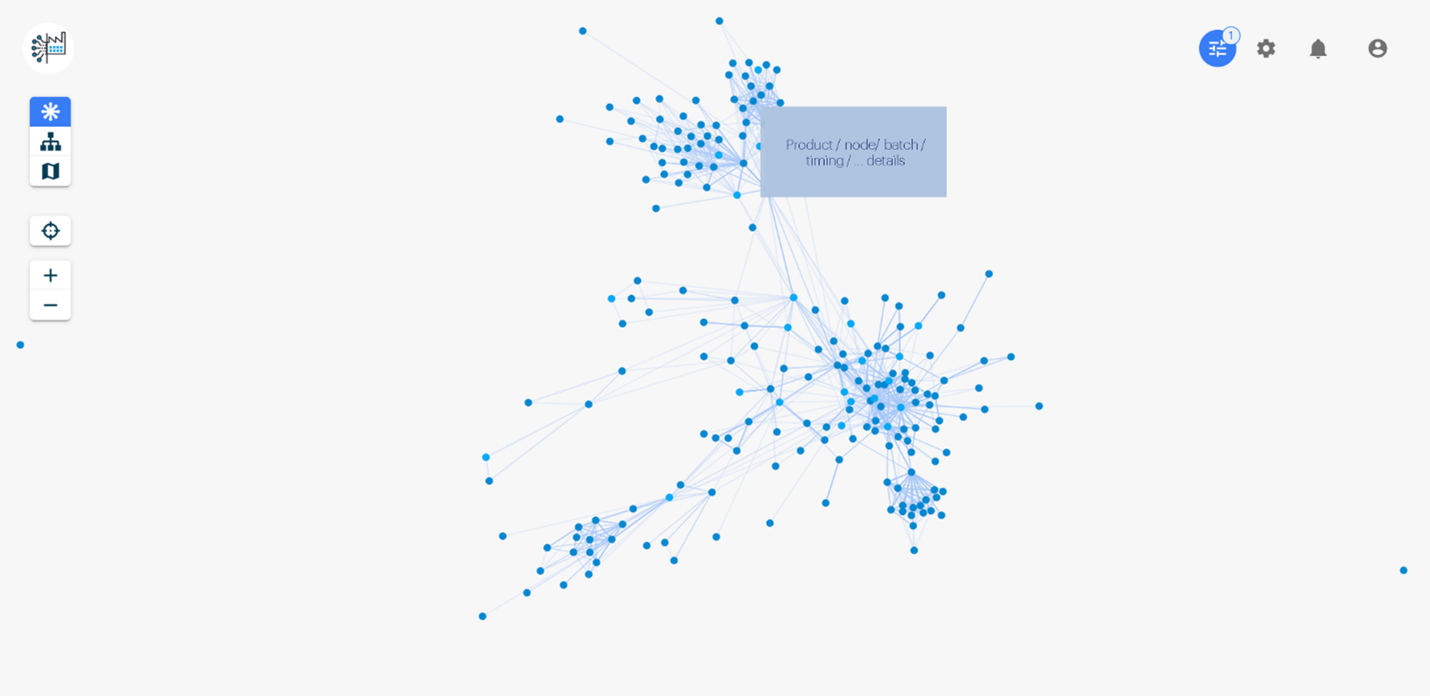
Once the data is associated, you can follow the materials through material ID changes and “anonymous” inventory locations to determine end-to-end product flows.
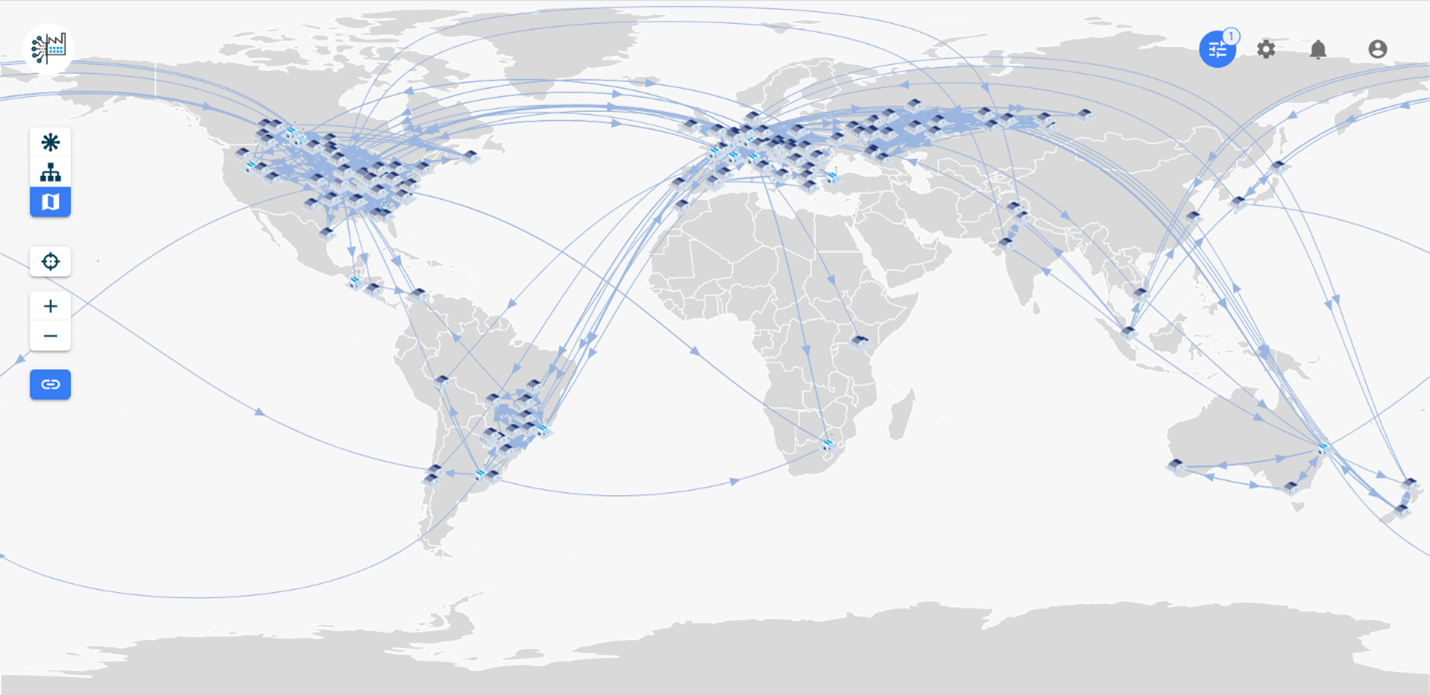
Now we can start the analysis that is more familiar to people who have used process mining before. Axon calls this supply chain contextualization. It’s the discovery of different flow variants, frequency of use, lead times and other performance characteristics. Notice the very familiar variant analysis visualization. You have the ability to see associated “happy flows” and select the flows/variants you want analyzed. You can also see proportion of the total represented by the selected flows/variants.
Analysis with Axon
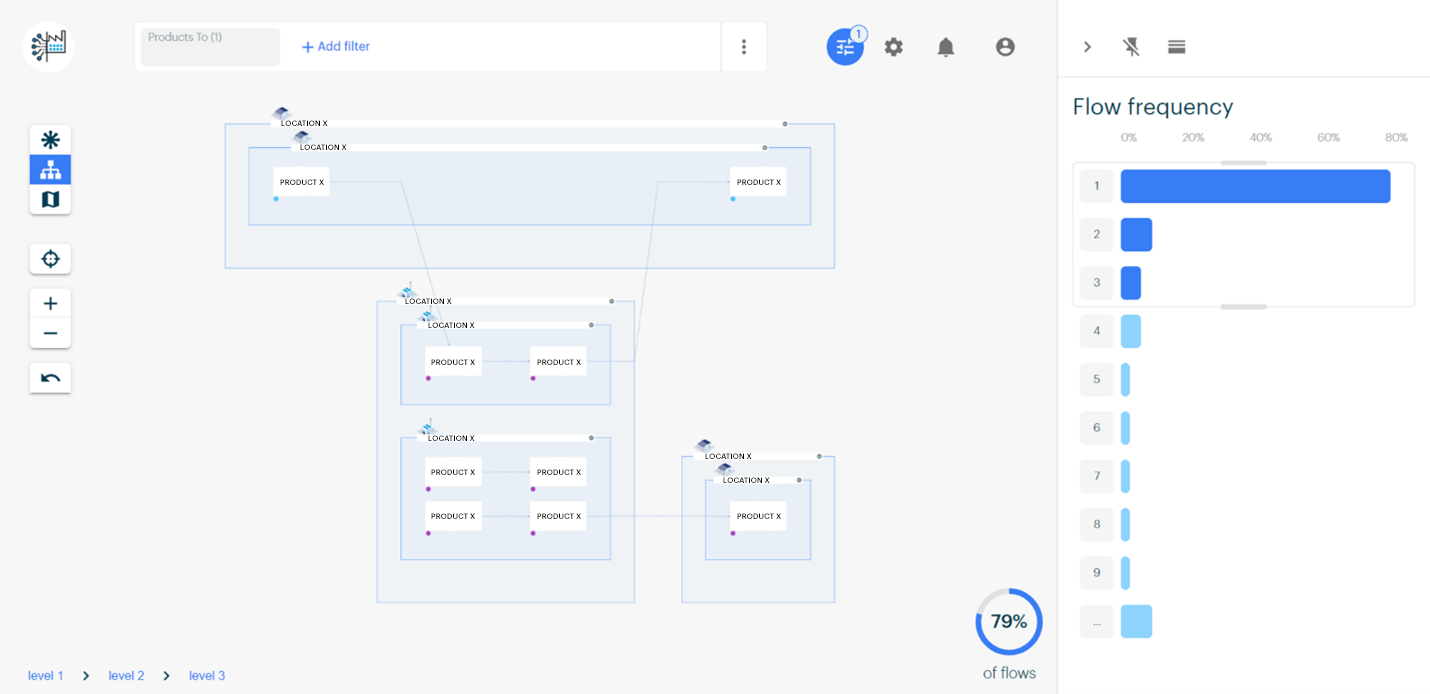
As with standard process mining tools, Axon can perform an in-depth analysis of the past performance of your supply chain to identify key areas of value leakage. You can also use Axon to feed better and dynamic planning parameters to deterministic planning tools such as OMP, SAP IBP, Blue Yonder and Kinaxis.
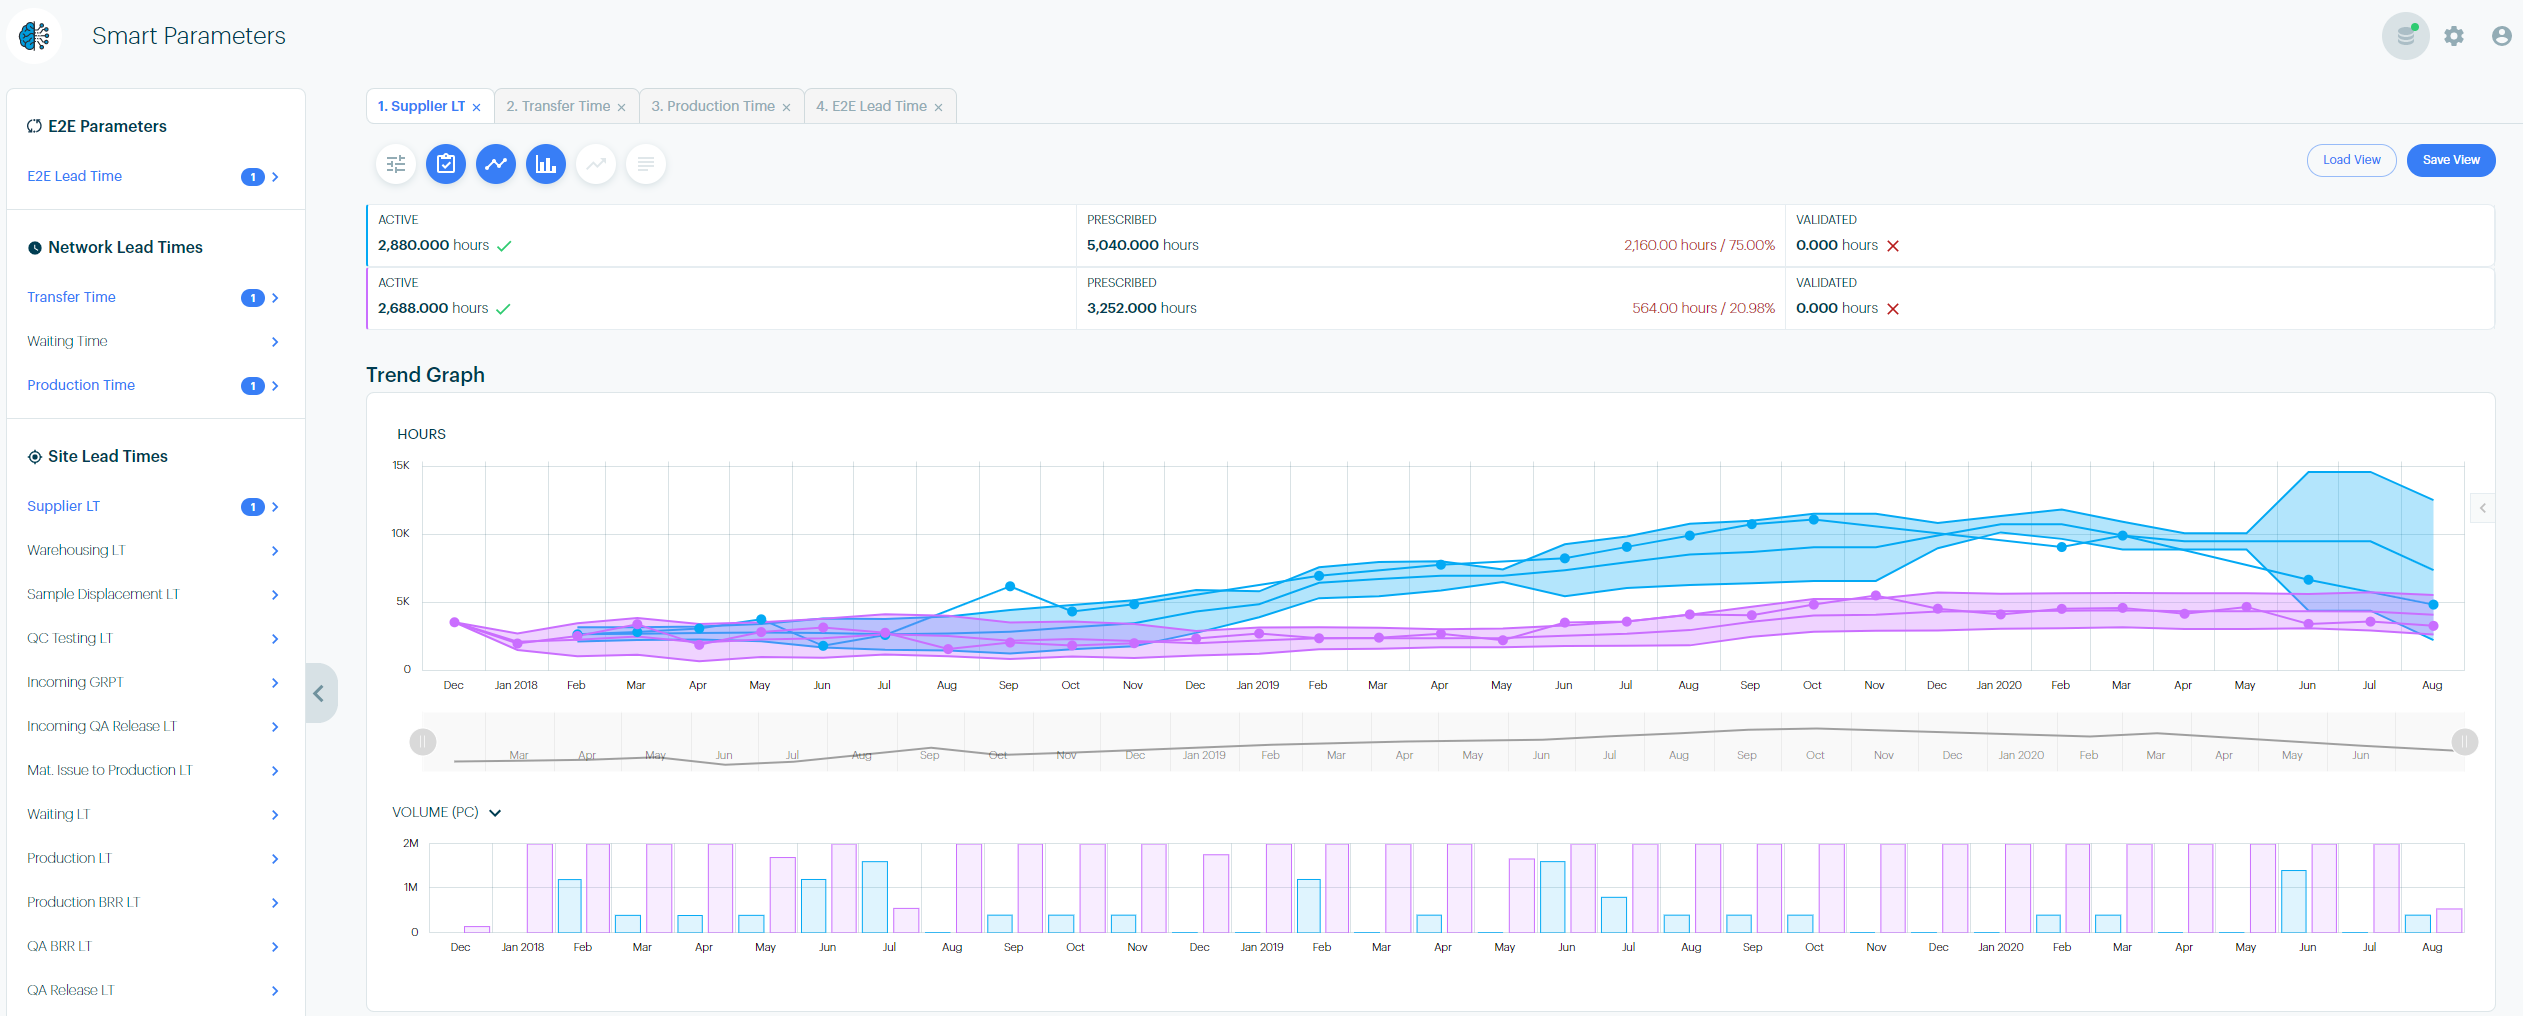
Putting this all together allows Axon to generate the very familiar value stream map below. The VSM below was generated across five different systems, with all the data association issues related to part number changes, unit of measure changes, time zone changes, etc. Notice also that, unlike traditional VSMs, Axon also provides the variability represented by the thin cyan vertical line (range) and blue bar (95% CI). You can learn more about value stream mapping in a recent blog by Axon Portfolio Manager Siem Jaspers.
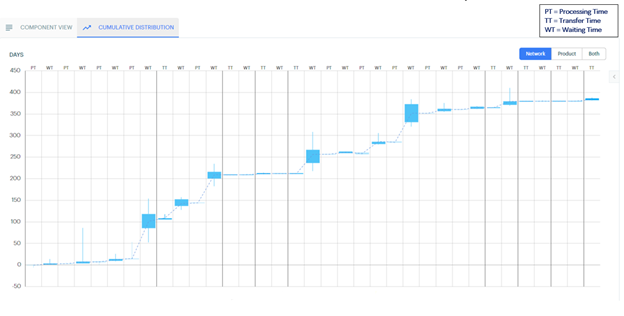
Not surprisingly, the VSM generated by Axon is consistent with the standard VSM maps in that the total waiting time far exceeds the total processing time. As mentioned above, Axon also provides an analysis of the variability. As we know from Lean/SixSigma principles, variability is a major cause of value leakage. Knowing where your material flow is most variable and putting activities in place to reduce the variability is a great boost to productivity.
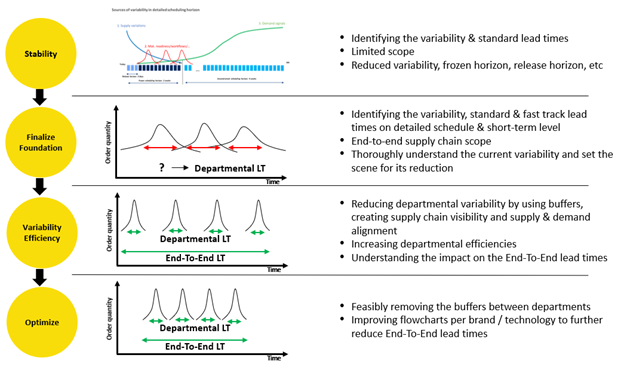
→ This type of analysis is used by our consultants to perform reliability projects, the first step of which is to build Axon’s digital supply chain twin from the transaction logs, associating data across multiple systems to identify the areas of greatest variability, reducing the variability to improve reliability, and then reducing the component lead times to improve performance.
If you have been trying to conduct value stream analysis of your manufacturing lines or supply chains using standard process mining tools, please get in touch with our experts at Axon. We’d love to help.
Read on below to discover more about data mining with a digital supply chain twin:


