Value stream mapping with a digital supply chain twin
If you’re looking to strengthen your supply chain operations, I would bet you’ve considered utilizing value stream mapping. It can help you get a better visual of the situation at hand and effectively plan for a more efficient future that reduces or eliminates waste in your value stream. I know that it’s almost an impossible task to create value stream mapping visuals, particularly with a manual effort and uncertain numbers. But I can assure you that with a digital supply chain twin, it’s possible—and it’s worth it.
In a rush? Watch the 1.5 minute video to see value stream mapping in action.
Want to see value stream mapping in action? Schedule a demo.
Why a digital twin can help
All of Axon’s customers have complex IT landscapes, within which data is scattered around multiple tools and different parts of the supply chain are covered by different systems. (For example, ERP 1 contains the upstream network, ERP 2 contains the downstream network, MES 1 contains the manufacturing reality for site X, etc.) Because the data is unharmonized, you need a lot of end-to-end business knowledge and time to tie it all together. Even with a data lake, the problem at hand remains the same, as you can read in this previous blog by my colleague Valérie Vandenbroucke, VP of Axon.
With a digital supply chain twin, you avoid the manual work previously required to create value stream maps.
Key questions answered with digital value stream mapping
There are several top-of-mind questions that digital value stream mapping can help you answer for your supply chain:
- What are your end-to-end supply chain flows and parameters, which are the basis for other deployments, such as an APS tool or a new ERP implementation?
- Is your supply chain performing according to the design, or are there deviations or risks?
- Where should you focus your improvement efforts to have the most impact on service, cost or cash?
- What would be a stretch goal for your supply chain if you remediate variability and strive for the golden end-to-end flow?
- Are you realizing the expected impact through the improvements you have set out to accomplish?
- What is your sustainability index based on the end-to-end carbon footprint?
- How do you best launch a new segment in your product portfolio?
- How are your physical and financial flows linked with one another?
You can answer all these questions—and more—with Axon’s digital supply chain twin.
(And you can check out how Sanofi started their value stream mapping journey with Axon in the video at the top of this page!)
Digital value stream mapping with Axon
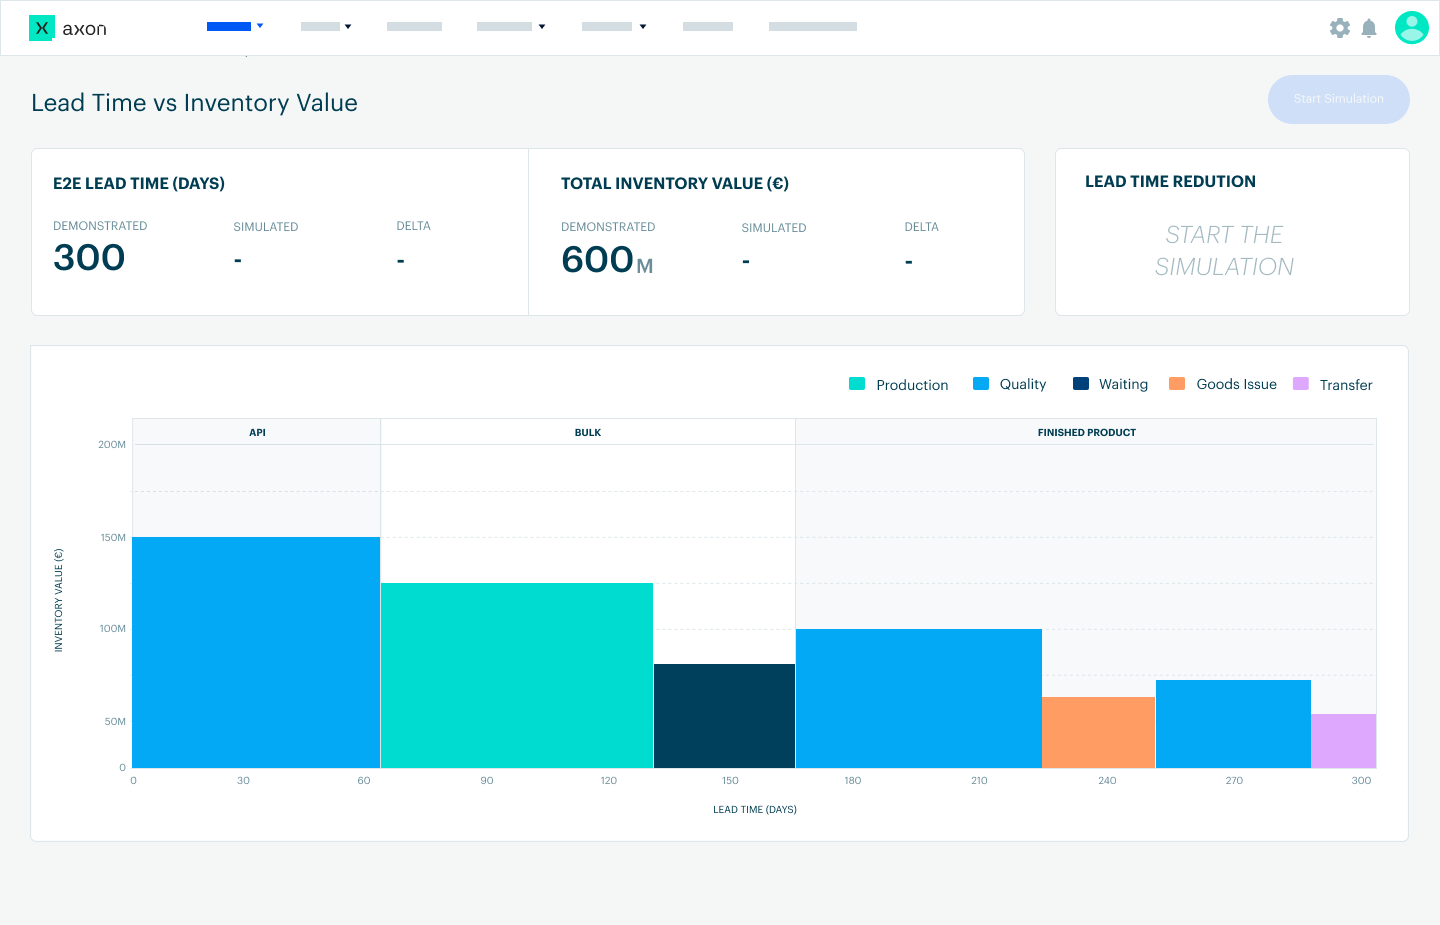
Axon’s digital supply chain twin gives you a visual of the value stream, from the product’s creation to its packaging for different markets and so on. It also shows you overlays for your value stream, including lead times (e.g. for production, quality, transport), and highlights how often certain flows are used versus others.
Value stream mapping with Axon allows you to visualize how much working capital you currently have per step and enables you to simulate what the future could look like if, for example, you could reduce the lead time of quality testing by a specific percent.

Not only are you able to clearly see how much of your assets are tied up in each step, but also the pockets of opportunity; the bigger the blocks of time, the bigger the potential monetary gains. You can then simulate the effects of lead time reduction on working capital requirements, which could be accomplished through master data correction or operational efficiency improvements, enabled by a digital supply chain twin.
The simulation aspect of Axon’s value stream mapping tool will show you the tangible effects of improving even just one step in the process. For instance, what if a 300-day testing segment could be reduced to 270 days? Well, the simulation will show that a working capital amount of $160 million could drop down to $128 million—over $30 million in savings.


