Binocs Community Day 2024: Announcing our Next Leap Forward
We're thrilled to announce Binocs Community Day 2024 on October 17th in Brussels and NJ, a celebration of our users and peek at what's to come
Read more

Project management concepts are ubiquitous in modern planning, including in resource capacity planning systems. In this article, Adam Lester-George explores critical path analysis and critical chain analysis, and their roles in resource management (including how they relate to the Binocs system).
If you already know a little bit about Binocs, you know that we provide comprehensive capacity management and resource scheduling solutions to some of the biggest players in the pharmaceutical industry. You may also know that we help our clients to improve on laboratory performance indicators, such as planning adherence and throughput. But what you may not know is that the principles underpinning the Binocs system are informed by cutting-edge techniques developed in non-pharma fields.
The modern pharma laboratory is a highly complex environment involving multiple teams, discrete specialisms, upstream dependencies, and shared resources. With all these moving parts, today’s standard operations are practically impossible to coordinate manually, so it is unsurprising that companies increasingly search for answers in the practices developed to help manage complicated workflows in other industries.
From “lean principles” to “operational excellence”, the business priorities of many labs are driven by concepts that originate in the world of project management. Even if your day-to-day focus is on managing processes for sample manufacturing and/or quality (rather than traditional projects), project management methodologies such as critical path analysis and critical chain analysis likely apply to your work more than you realize.
Indeed, such principles are part of the reason that Binocs is able to substantively optimize lab operations such as batch release, stability testing, clinical testing, and method validation, and provides real-time critical chain scheduling. The latter is all the more crucial for our clients in cell and gene therapy (CGT) production, where each patient treatment is unique, variability is high, and buffers are low and dynamic.
But what does all of this mean in practical terms and what’s so critical about the critical chain?
2021 marks 25 years since the publication of one of the most influential books in the field of management and productivity. In 1996, the Project Management Institute released the first edition of “A Guide to the Project Management Body of Knowledge”, or “PMBOK Guide”, which introduced a generation of clerical staff to new concepts in planning and organization.
Of course, with its roots in mid-20th Century, large-scale engineering programs, the history of project management long predates this landmark publication. Such complex and multifaceted programs of work required precision timing and detailed organization to facilitate the convergence of inputs from a range of contributors in a predictable and timely fashion. Nevertheless, the PMBOK (and its subsequent periodic updates) played a pivotal role in popularizing Project Management as both a stand-alone vocation and as a critical characteristic of all managerial positions in an era of work typified by the increasing dominance of precision technology and multidisciplinary teams.
The central purpose of project management is to deliver activities within the constraints of scope, budget, and time. Its methods emphasize optimizing the allocation of inputs from different sources and applying these in the most efficient way to meet pre-defined objectives. An essential tool in facilitating such optimization and efficiency is Critical Path Analysis (CPA), which directs planners to identify (and estimate the duration of) the longest stretch of activities in a network of interdependent project tasks. In theory, by quantifying this path, one can estimate the shortest possible time required to complete the entire project. So long as they prioritize the critical path, all other activities can fall in behind it.
For instance, in the following example, the longest sequence of dependent activities begins with Geoff’s contribution and ends with Craig’s; this is the critical path (highlighted in orange):
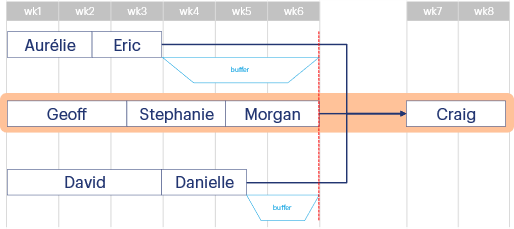
The primary limit on the project duration is the time it takes for Geoff, Stephanie & Morgan to deliver their contributions to Craig. So long as Aurélie & Eric and David & Danielle can complete the work in their two non-critical paths before the end of Morgan’s task, they will not affect overall delivery. This approach ensures that the project planner can estimate how long the project will last and factor in specific “buffer” periods, giving the non-critical paths a certain degree of flexibility with their delivery windows.
CPA is a conceptually straightforward approach when applied to such a simple example; nevertheless, this method of qualifying and quantifying time allocation significantly elevated the ability of managers to plan complex projects that require input from multiple interdependent teams subject to their own bottlenecks and constraints. The CPA planning approach owes much of its foundation to projects in tightly-controlled environments, such as production lines and organizations with highly-siloed work performed by dedicated workforces. As a result, however, it presents some distinct limitations when applied to more agile work environments. Two such limitations that emerge in more dynamic and unpredictable settings relate to variability and resource sharing.
For instance, the critical path is highly sensitive to the accuracy of estimates surrounding the duration of tasks and their interdependency as established at the planning phase. If a task takes significantly longer than expected to complete – even in a non-critical path – it substantially impacts the initial timelines; the same situation applies when bottlenecks in a different project cause a worker to be delayed and thus a task to begin late. Such types of variability are difficult to accommodate because, within the limitations of the methodology, they represent unknown external risks.
CPA defines the basic work plan according to the tasks whose delivery is required to achieve project completion. The resources needed to complete those individual tasks (personnel and equipment) are essentially assumed to be unlimited and disposable, ready to be deployed as soon as each preceding task is complete. The reality of most workplaces (and certainly all pharma labs) is that resources are finite and competencies and availabilities are highly restricted.
Let’s return to the previous example but now the starting tasks in the non-critical paths require specialized skills that neither Aurélie nor David are qualified to perform. Instead, Stephanie is now responsible for those tasks (in addition to the work already planned):
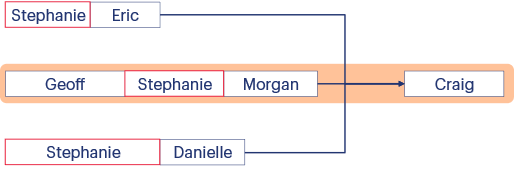
In the above case, the sequence of tasks Geoff>Craig remains the critical path; however, this new plan introduces a conflict because it requires a resource (Stephanie) to work across all three paths. Since multiple tasks cannot be performed simultaneously by the same resource, it is no longer possible to reorganize the tasks within the pre-established “buffers” to allow delivery within the original timeline defined by the critical path. This is where Critical Chain Analysis becomes indispensable.
Critical Chain Analysis (CCA) is an adaptation of CPA based on the Theory of constraints and considers both the dependency of tasks and the dependency of resources. As a result, it accounts for the impact of resource sharing, both within a given project and between unrelated projects, thus allowing for a more dynamic planning system. CCA reformats the CPA approach in several ways:
The overall result is a lean project plan that has trimmed all the fat from each task and consistently reintroduced the buffer to maximize flexibility. CCA aims to minimize the amount of project buffer consumed at each step in the project and to complete all tasks before the end of the planned project duration.
Returning to the previous example, the following diagram depicts the critical chain (in green) as defined according to the above principles:
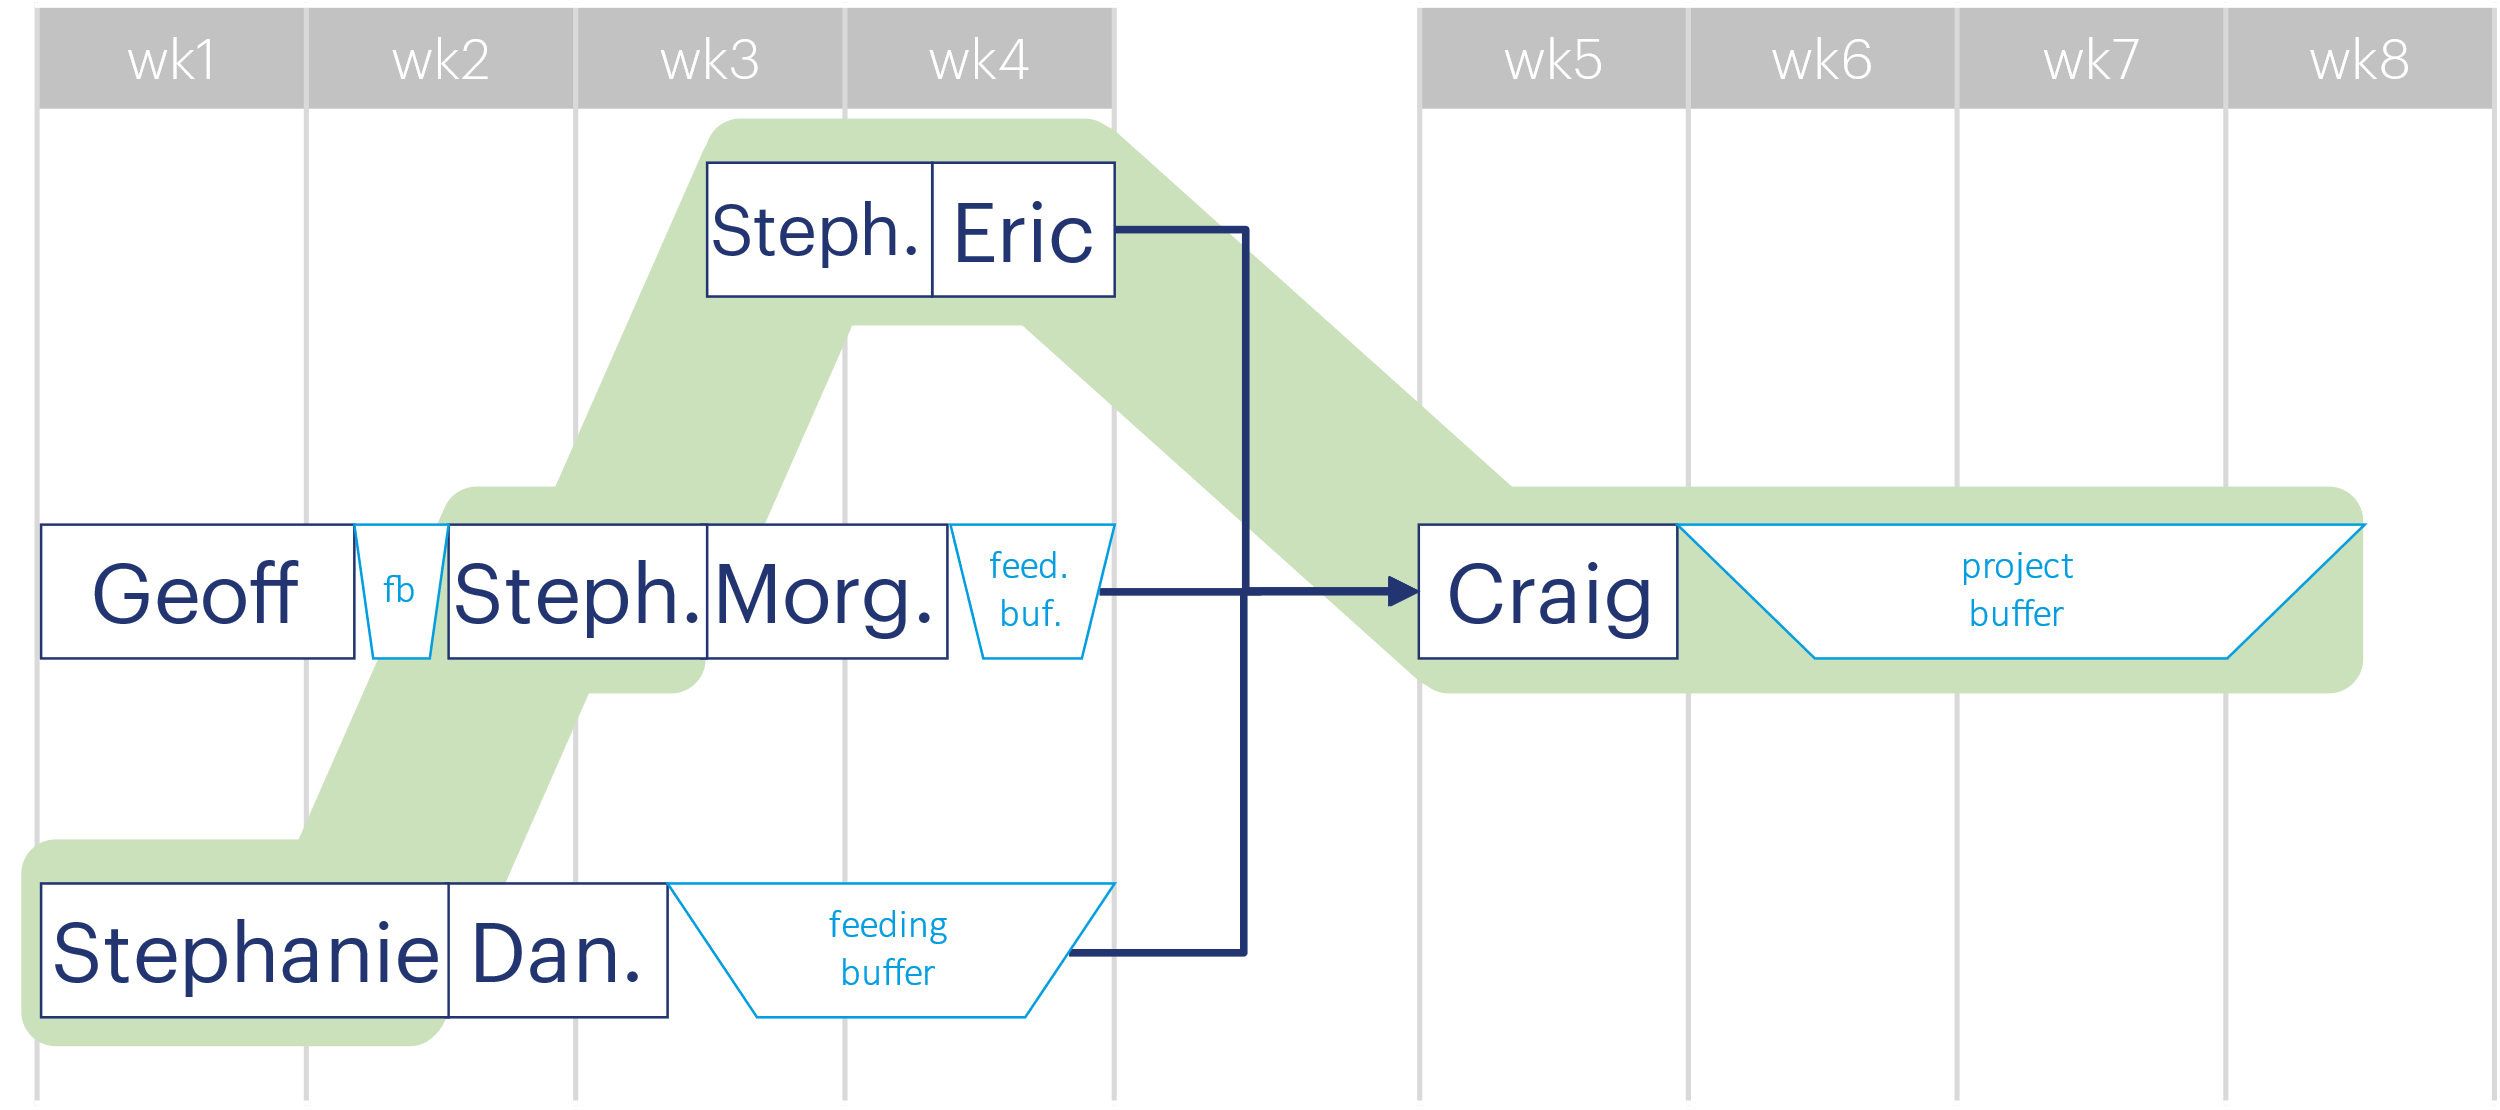
In this case, Stephanie is the limiting resource, so the priority must be to level her tasks. This means that Geoff’s task gains a small amount of feeding buffer while awaiting the completion of Stephanie’s first task, and Morgan & Danielle also have feeding buffer added to their allotted time, pending the completion of the parallel tasks in the critical chain. Meanwhile, Stephanie, Eric & Craig can consume the project buffer if any of their tasks overruns its estimated duration.
It is possible to illustrate the project progress at any time on a “fever chart”, which plots the completed tasks against the overall amount of project buffer that has been consumed (with critical chain tasks highlighted in red):
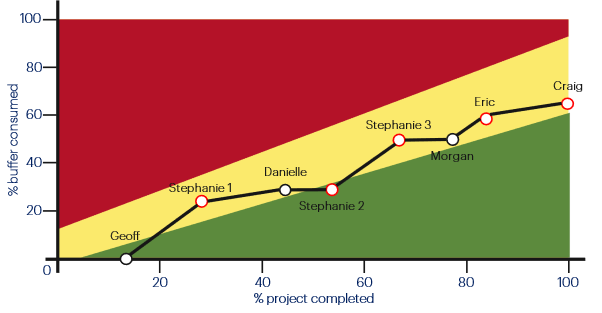
This chart shows that the final project delivery ended in the yellow “warning” zone, but it also shows that the project ended with 40% of the project buffer remaining. Reviewing the critical chain diagram, 60% consumption of the project buffer indicates that the project lasted roughly 6½ weeks, a significant improvement compared with the 8-week plan generated via critical path analysis.
An added feature of the fever chart is that it allows planners to identify bottleneck activities. For instance, the above chart demonstrates that Stephanie was responsible for consuming a lot of the project buffer, particularly when completing her first and third tasks; this, therefore, suggests the need to revise the estimated durations of those activities.
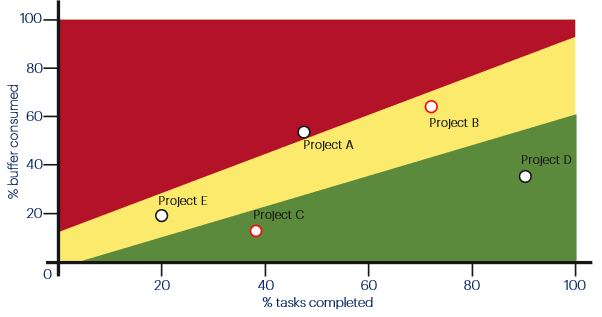
Fever charts are also helpful for tracking the status of all the simultaneous tasks dependent on a resource shared across projects. For instance, Craig may be responsible for tasks in five different ongoing projects, some in the critical chain and others not. In the following chart it is clear that, even though his tasks in Project A are in the red (“late”) zone and his contributions to Project D are almost delivered, his tasks in these two projects are non-critical; in fact, his priority should be Project B, in which his critical contribution will have the most impact on overall on-time delivery.
But how does this relate to Binocs’ own capacity planning function? Certainly, a form of critical path analysis is already embedded in the demand creation phase: operating models can be created – either manually or based on a zero-code integration with third-party software such as MS Project – with a critical path and elasticity (buffer) explicitly defined as parameters and with specific dependencies between demand items. As highlighted above, though, a management system that doesn’t account for the availability and dependency of both tasks and resources will, ultimately, always fail. The critical chain must be identified.
In August 2021, Microsoft published a comprehensive white paper exploring the role of CCA in creating a resource management system, indirectly highlighting just how well-suited the Binocs system is to the critical chain approach. In particular, the paper isolated five essential concepts for implementation as part of critical chain planning, which the Binocs system already fulfills:
Binocs, can, however, go one step further than these five concepts because the critical chain is already taken directly into account. By automatically prioritizing resource use, Binocs accommodates multidimensional workflows, with resources shared across projects and the best-fit allocation of work calculated dynamically. This occurs both at the capacity planning stage and at the day-to-day scheduling phase: the critical path is defined when building the demand model and when the Schedule is run (automatic) or adapted (manual). Indeed, because the Binocs system constantly and dynamically levels workload, a correctly implemented project means that no task will be displayed as “late” unless its completion directly impacts critical tasks.
Of course, the planning algorithms are not the only aspect of CCA already embedded in Binocs – the system also features advanced reporting and workflow functionality. For instance, the Batch Tracker is an off-the-shelf dashboard that allows users to identify which process batches are running late so that other downstream tasks can be replanned or deprioritized. Indeed, the new Workflow KitBox allows management to define the parameters for which downstream tasks can be automatically deprioritized or delayed by systematically updating due dates relative to the lateness of upstream activities, thus constantly adjusting the critical chain of tasks.
What does this look like in real life? Binocs has been used to schedule across multiple labs to release more batches at the same lab throughput as prior to its implementation. The QC lab that served as a case study for this example termed this system “Smart FIFO” and you can read more about it here.
Adam has two decades of experience working in clinical trials, biomedical research, public health, and health economics, with a particular interest in the intersection between technology and life sciences. For 7 years before joining Bluecrux in 2019, Adam was the director of healthcare innovation consultancy “LeLan” and brings a wide range of insights to his role as Content Specialist for Binocs.