
Binocs Community Day 2024: Announcing our Next Leap Forward
We're thrilled to announce Binocs Community Day 2024 on October 17th in Brussels and NJ, a celebration of our users and peek at what's to come
Read more

In this second article in the series on the role of project management methods in lab planning, Adam Lester-George explores the challenges facing pre-clinical studies and how Binocs Gantt charts can help R&D laboratories define and adhere to optimal development plans.
In the previous article in this series, we discussed the role of concepts such as the critical path and the critical chain in resource planning, featuring insights into how project management principles can elevate lab planning, how the Binocs algorithms use them, and why:
The central purpose of project management is to deliver activities within the constraints of scope, budget, and time. Its methods emphasize optimizing the allocation of inputs from different sources and applying these in the most efficient way to meet pre-defined objectives.
Drug development is a complex process with a range of objectives, tight timelines, strict budgets, and inputs from disparate sources. This process has been rendered all the more complicated by the COVID-19 pandemic and the additional resource worries it presents for labs.
All stages of drug development are time-critical but gaining an investigational new drug (IND) approval represents a significant first hurdle on the route to delivering a newly-developed therapy for clinical testing. It is typical to begin this pre-clinical planning process by identifying a suitable IND filing date, then to work backward from that point to plot the necessary stages of development and testing. Many of these stages are highly complex and can be subject to delays, especially during the various safety and toxicology studies that might be required.
For this reason, pre-clinical studies must establish clear project plans to identify and overcome bottlenecks on the path to filing their application with the relevant local and international regulatory bodies (the FDA in the USA, with similar processes at the EMA in the EU, MHRA in the UK, NMPA in China, etc.). It is also imperative that such plans include sufficient buffer to accommodate and minimize the impact of unexpected events and that planning details are clearly communicated to all internal and external stakeholders.
This is why it is now typical for research and development (R&D) managers to lay out a detailed plan of their route to IND filing using a method that visually presents work and responsibilities over time: Gantt charts.
As the US entered World War I in 1917, the Army Chief of Ordnance, General William Crozier, suddenly found that his Department’s workload had dramatically increased. Munitions orders that had previously been counted in the hundreds now leaped to the scale of millions. This sudden change in demand immediately defeated the existing requisition processes, which, until that point, had been handled on a case-by-case basis, with one item per type-written page and no indication of time constraints. General Crozier’s purview had just escalated from overseeing a relatively static inventory to being responsible for a highly complex and multifaceted supply chain in an aggressively demand-driven market and with stakeholders spanning teams from R&D to large-scale overseas distribution.
Luckily, the man in charge of furnishing the US Army with weapons had a secret weapon of his own hidden away in the Frankford Arsenal.
The US entry into WWI was under debate far in advance, and Crozier, like any good planner, used this time to anticipate significant bottlenecks in his Department’s existing systems. By the time US forces did join the Allied powers, he had already researched newly-developed industrial planning practices used in Pennsylvania steel mills and textile factories. Witnessing first-hand the efficiencies they had introduced, he immediately recruited the man responsible for implementing the radical new methods.
Henry Gantt had spent the previous years developing scientific management principles for production facilities and dramatically increased productivity using a new type of bar chart visualization. This chart illustrated the planned work for manufacturing machines, grouped by task and laid out according to the time required to perform those tasks. This served as an excellent starting point for overhauling the Ordnance Department’s planning system. Under Crozier’s direction, Gantt further developed his approach to meet the far more complex challenges of the wartime supply chain by introducing a comparison between promised work and actual performance.
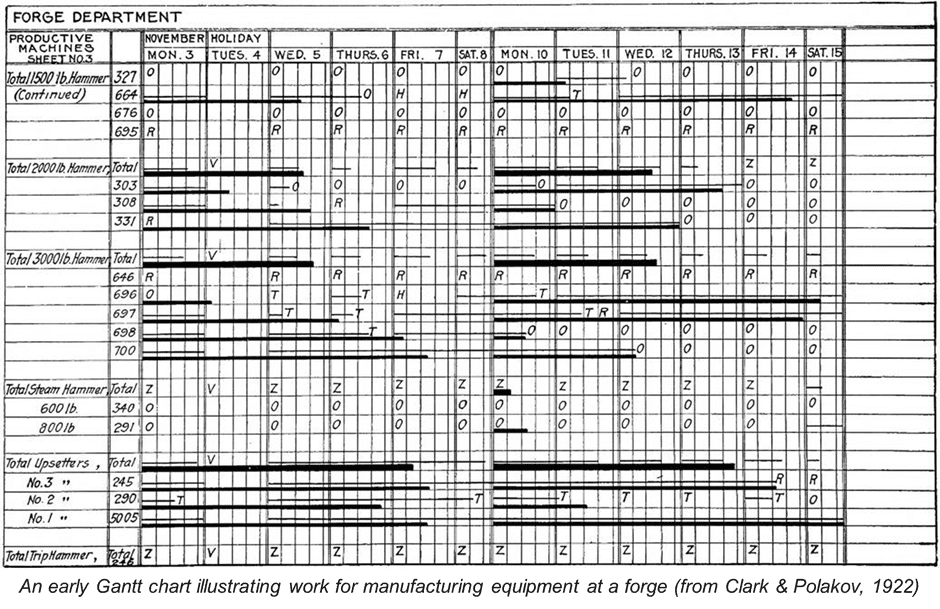
The resulting “Gantt Progress Chart” introduced an entirely new approach to planning and both military and civilian organizations soon adopted the methodology. The chart presents unique resources along the Y-axis and plots planned work overtime as bars along the X-axis, allowing progress against targets to be updated, the impact of delays and pinch points to be forecasted, and the cumulative cost of activities to be calculated. Today, the materials may have shifted from pen and paper to personal computers but, with products like Microsoft Project and Smartsheet, Gantt charts are still very much alive and adapting to contemporary technical pressures.
The key benefit of the Gantt chart was (and remains) its dynamism; to quote the preface to “The Gantt Chart: a working tool of management” (1922), they “are not static records of the past — they deal with the present and future and their only connection with the past is with respect to its effect upon the future”.
Visual, real-time progress-tracking of project deliverables against key objectives and milestones allows managers to amend and adjust future work based on present conditions. This makes the Gantt chart ideally suited to the task of R&D lab planning, where resources are often limited and where missing a regulatory deadline due to upstream delays can have significant consequences for the wider business.
It’s easy to understate how important the correct and timely filing of an IND application is to the successful development and patenting of new drug products. Drug developers are in close competition with rival companies in a narrow field, with time-to-market measured in years and relatively short patent terms. The race to full approval and final IP (intellectual property) exploitation is highly susceptible to delays.
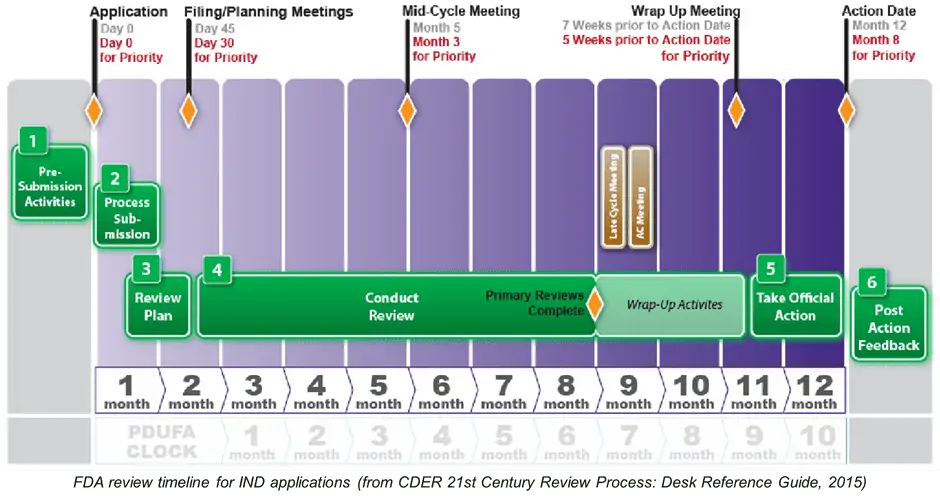
Even prior to filing an IND application, planners need to accommodate a range of pre-submission activities such as meetings and communications; once filed, the regulatory approval process for the pre-clinical study phase can take up to a year to complete. Without the approval, FIH (first in human) clinical trials cannot proceed, the final product cannot be commercialized, and the target patient cohort will not have access to their new treatment. If, for instance, applicants miss a submission deadline by even a day, the FDA (or other regulatory authority) can reject the entire application and force a new filing date to be scheduled and the process re-started. Similarly, if the application does not meet highly specific and detailed safety reporting requirements, the regulator can immediately reject it without further consideration.
Resource limitations can be especially severe in smaller pharma companies, where the workforce dedicated to R&D activities can be significantly restricted (especially post-COVID-19). Whereas larger companies might have the capacity for dedicated project management professionals to plan their pre-clinical studies, for many smaller labs the work might fall to a lead scientist as part of a much broader roster of tasks. Frustrations with the lengthy application process, limited hours in the day, and a lack of clear visibility on task progress from different contributors can have dramatic ramifications for the timely submission of the required paperwork.
Some stages in pre-clinical operations, particularly in vivo processes such as range-finding, toxicity, and safety studies, may require significantly more oversight or come with very narrow delivery windows and an added ethical pressure to avoid retesting. Managing these time-sensitive, short-term tasks can be tricky, especially when being delivered in parallel with a range of other pre-submission activities.
In addition to the challenges of managing study time and resources, it is increasingly a requirement for pre-clinical researchers to track detailed financial metrics, either for internal KPIs or for Sponsor oversight and ongoing fundraising activities. It might be relatively simple to make cost estimates before study launch but, without a systematic approach to monitoring task progress in real-time, it can be incredibly difficult to track the subsequent financial burn rate accurately. An underprepared study manager risks missing time and economic targets before the first stages of research material production are even complete.
Following the traditional Gantt approach, typical project management tools such as MS Project are highly effective at planning activities and dependencies over time. Even though such tools have been purpose-designed for project management tasks, they are rather complicated to use and often require a significant investment of time and training, while also rarely providing a wider suite of functionality that is useful to R&D labs. Unfortunately, they may simply not be adequately equipped to handle the complexity, dynamism, and communication requirements of a pre-clinical drug study without a substantial amount of manual work.
Luckily, much like General Crozier, modern R&D managers can now launch into the battlefront with a secret weapon in their arsenal!
Binocs is the market leader in resource management and scheduling for QC pharma labs because it has been designed with the pharma lab in mind.
Nevertheless, it might not be your first thought when considering options for pre-clinical R&D labs, where small quantities of research material are produced and in vivo / in vitro testing is conducted by individuals, rather than thousands of batch samples being tested by teams of QC analytical chemists. However, Binocs has been built with the complete pharma life cycle in mind, designed to support specialist teams from early-stage development all the way through to full-scale commercial distribution and quality control.
In Binocs, all tasks are defined according to different work types (services) and assigned responsibilities, easily covering the range of activities that is required over the course of a standard pre-clinical study and workforce training for those activities can readily be mapped in a competence matrix to highlight potential skills or knowledge gaps. Services can be tagged with their respective direct and indirect costs, and the associated tasks and milestones can be grouped and saved as templates for later use, meaning that study managers can outline a typical work package with associated costs far in advance.
These different, pre-defined modules can then be added to the relevant Demand Channels (workstreams) as required when new development projects are requested. By creating a special “Operating Model” Demand Channel, they can further automate the creation of work plans with predetermined triggers, critical path dependencies, and flexible buffers.
A Binocs-enabled pre-clinical division may have their work spread across multiple Demand Channels, with contributions from a range of R&D teams to various different studies. By having all workstreams compiled in one place, Binocs provides an effective overview of pre-clinical operations, giving managers the oversight they need.
A fully populated Demand Channel can therefore serve as:
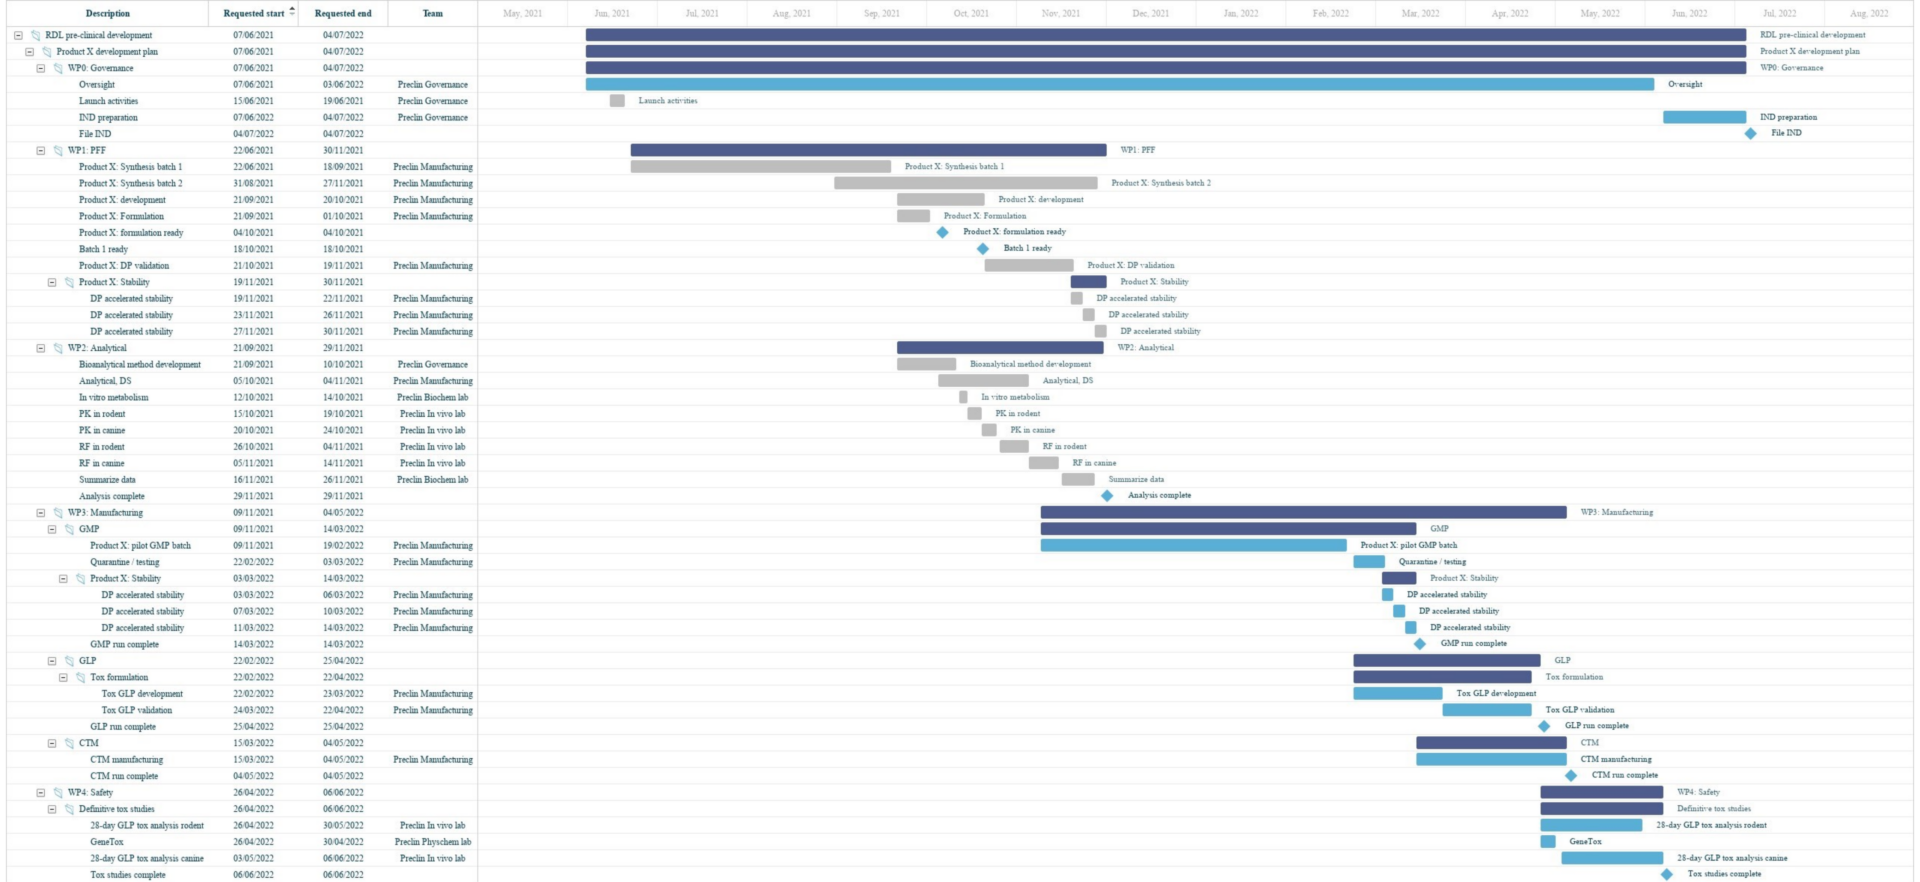
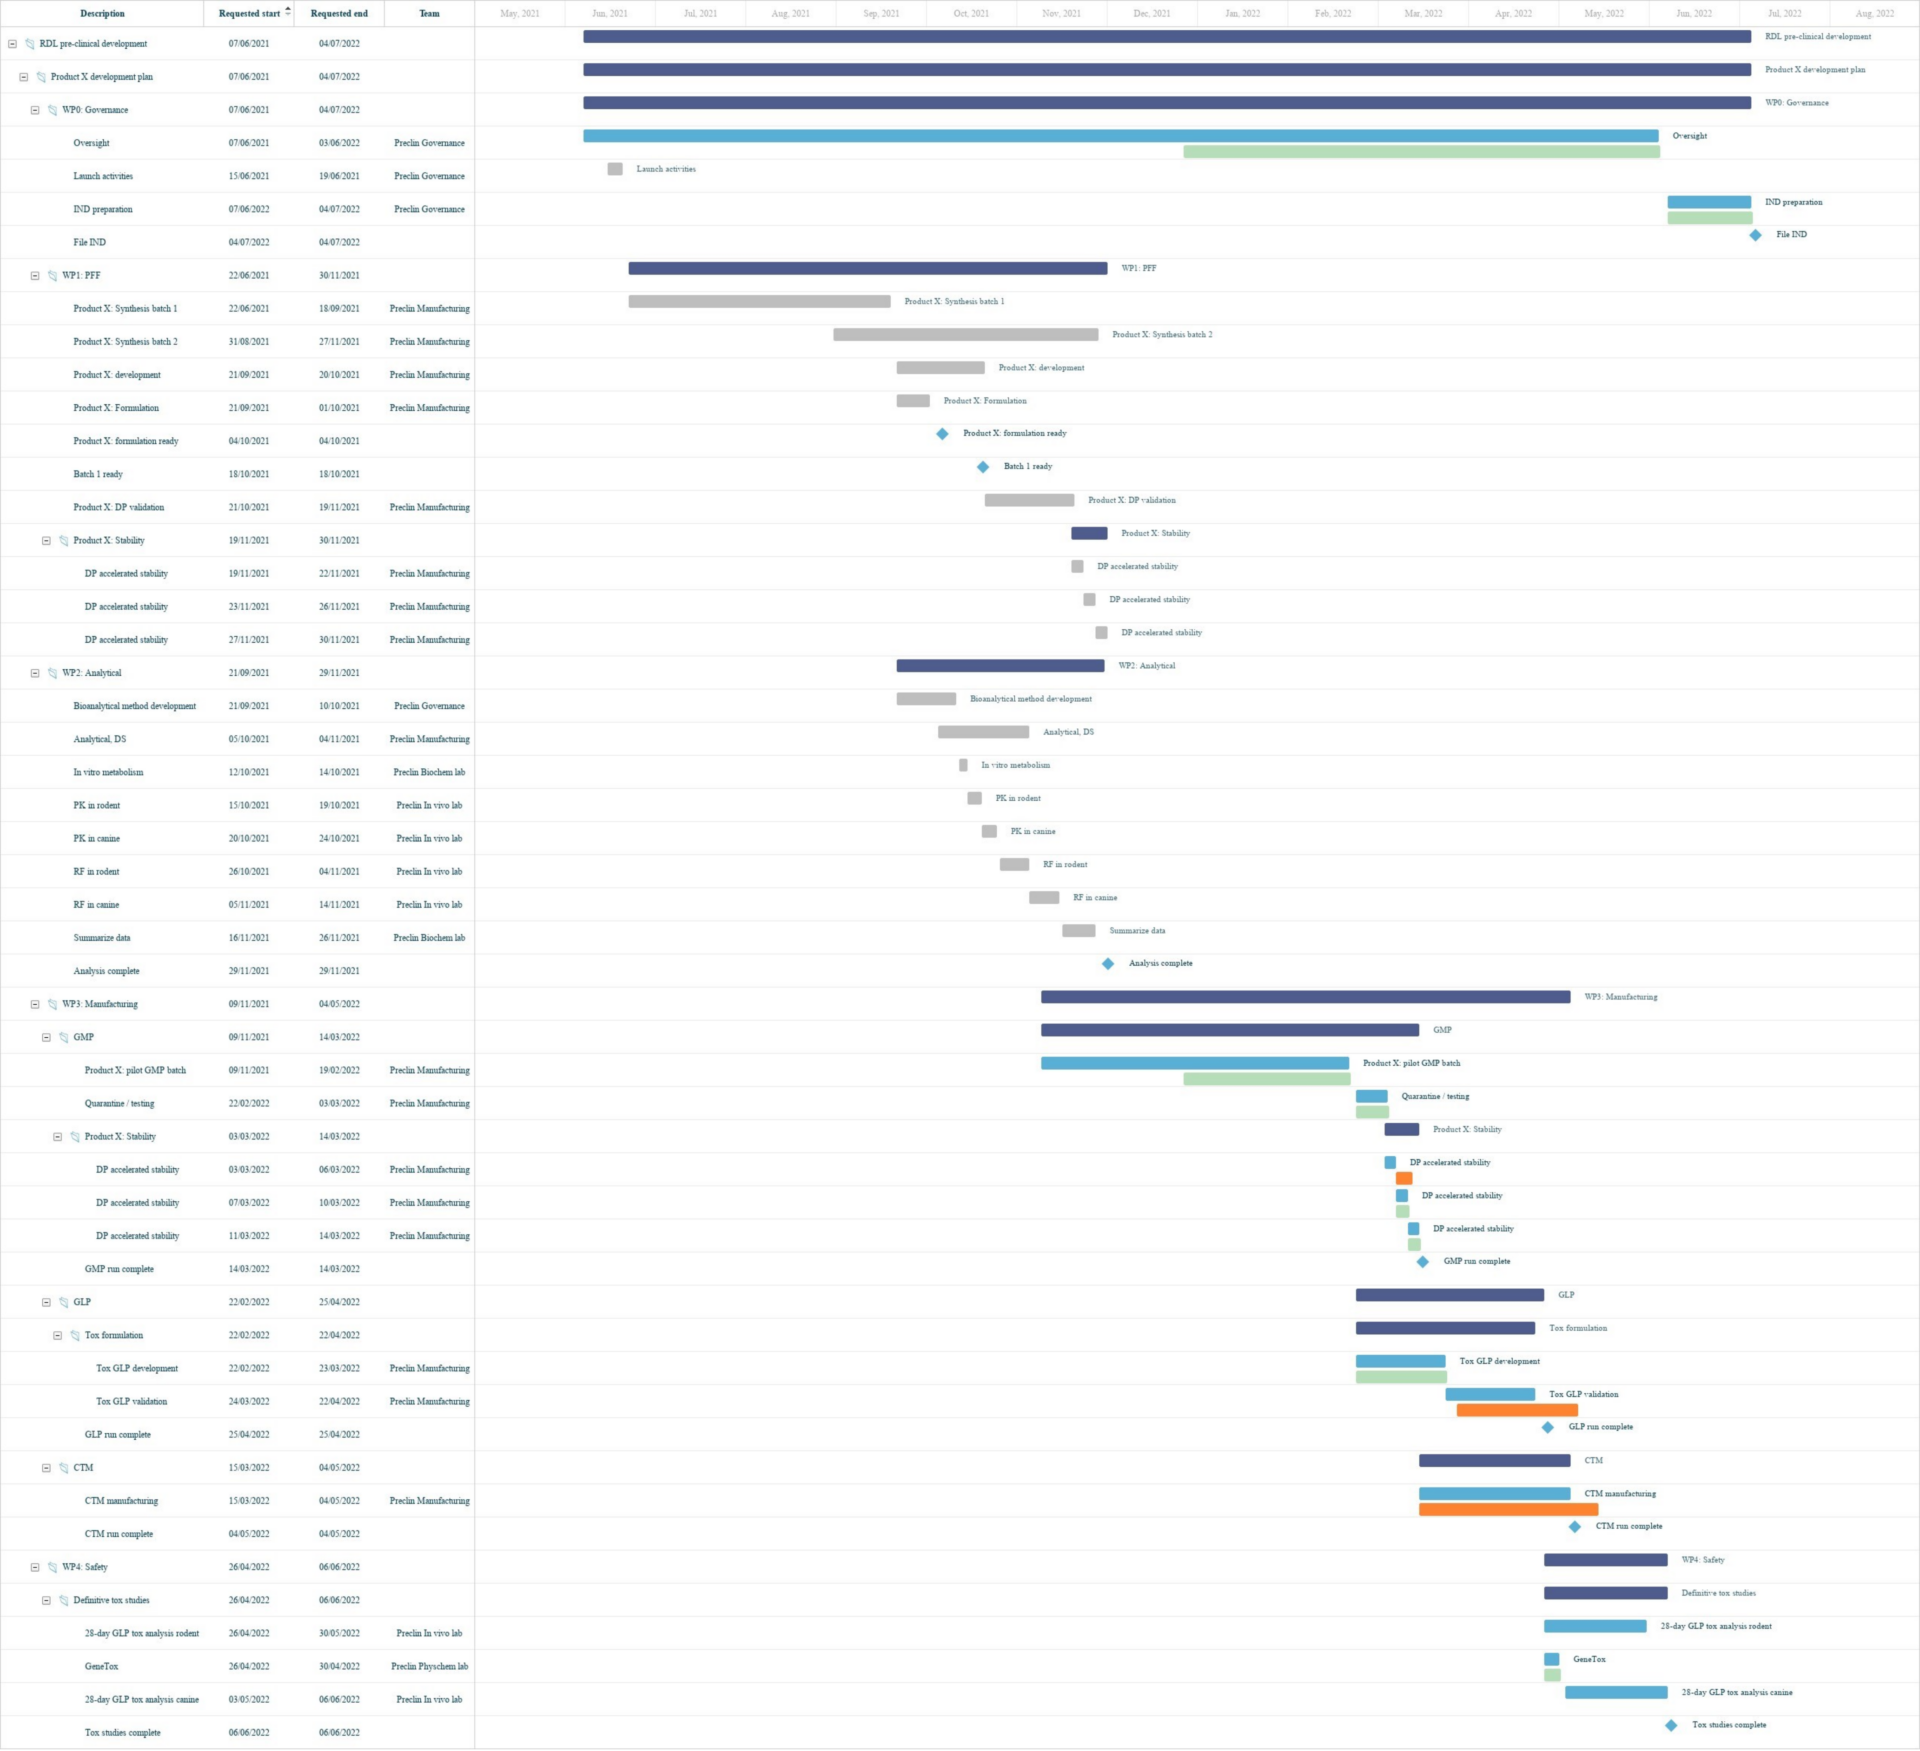
Binocs Gantt allows you to visually manage your studies and effectively communicate responsibilities and progress with internal and external stakeholders.
Binocs doesn’t just present planning information based on the agreed timelines from the start of the study – the planning and capacity management algorithm identify the optimal plan based on your available resources and highlights where tasks risk being delivered late. The Binocs lab planning Gantt chart provides an at-a-glance visualization helps you to quickly identify those future capacity bottlenecks and solve them before they happen, keeping work on track towards that crucial IND filing deadline.
Binocs is also a fully equipped resource scheduling system designed specifically for labs. This means that more complex or sensitive short-term work can be broken down into standard work activities and dynamically planned on day-to-day, task-by-task scale with algorithmically optimized allocations to personnel and equipment. This allows detailed task management to deliver and track time-sensitive, first-time-right work so it can be executed flawlessly, avoiding unnecessary retests.
Are you interested in learning more about Binocs Gantt and our other features that are ideally suited to your pre-clinical planning needs? Why not contact us today for more guidance resources or to schedule a demo of the Binocs system!
Adam has two decades of experience working in clinical trials, biomedical research, public health, and health economics, with a particular interest in the intersection between technology and life sciences. For 7 years before joining Bluecrux in 2019, Adam was the director of healthcare innovation consultancy “LeLan” and brings a wide range of insights to his role as Content Specialist for Binocs.